

A long neglected world malaria map: Plasmodium vivax endemicity in 2010
- PMID: 22970336
- PMCID: PMC3435256
- DOI: 10.1371/journal.pntd.0001814
A long neglected world malaria map: Plasmodium vivax endemicity in 2010
Abstract
Background: Current understanding of the spatial epidemiology and geographical distribution of Plasmodium vivax is far less developed than that for P. falciparum, representing a barrier to rational strategies for control and elimination. Here we present the first systematic effort to map the global endemicity of this hitherto neglected parasite.
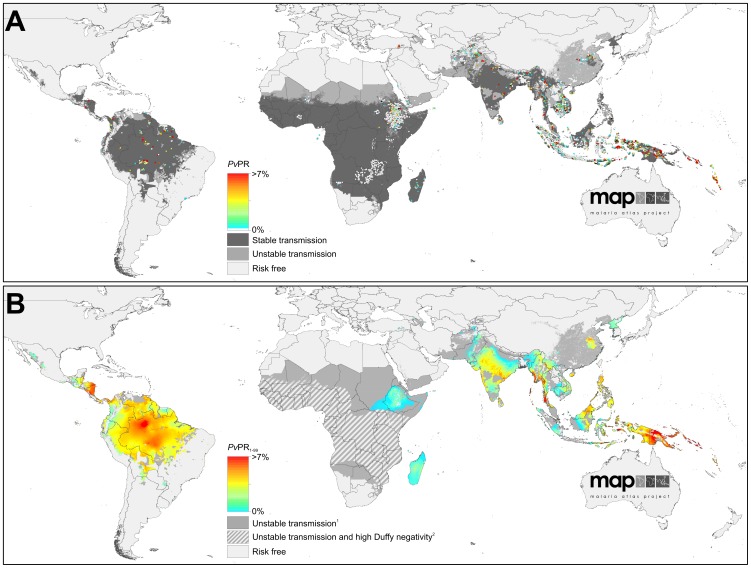
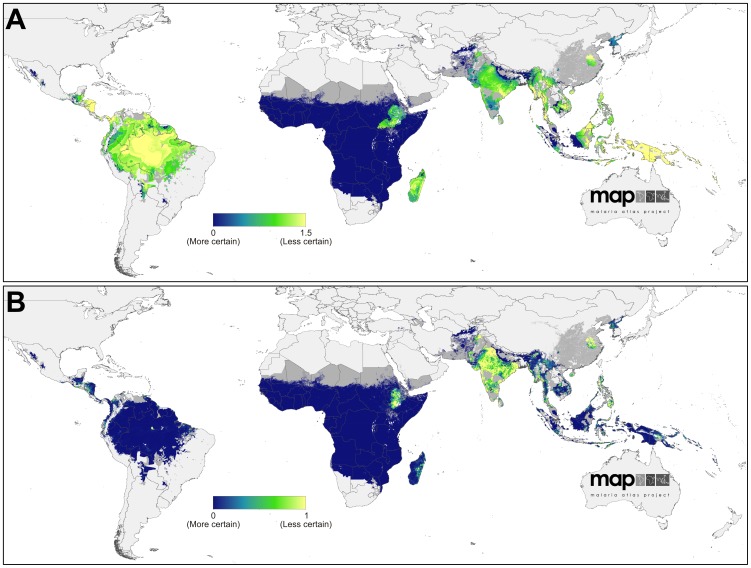
Methodology and findings: We first updated to the year 2010 our earlier estimate of the geographical limits of P. vivax transmission. Within areas of stable transmission, an assembly of 9,970 geopositioned P. vivax parasite rate (PvPR) surveys collected from 1985 to 2010 were used with a spatiotemporal Bayesian model-based geostatistical approach to estimate endemicity age-standardised to the 1-99 year age range (PvPR(1-99)) within every 5×5 km resolution grid square. The model incorporated data on Duffy negative phenotype frequency to suppress endemicity predictions, particularly in Africa. Endemicity was predicted within a relatively narrow range throughout the endemic world, with the point estimate rarely exceeding 7% PvPR(1-99). The Americas contributed 22% of the global area at risk of P. vivax transmission, but high endemic areas were generally sparsely populated and the region contributed only 6% of the 2.5 billion people at risk (PAR) globally. In Africa, Duffy negativity meant stable transmission was constrained to Madagascar and parts of the Horn, contributing 3.5% of global PAR. Central Asia was home to 82% of global PAR with important high endemic areas coinciding with dense populations particularly in India and Myanmar. South East Asia contained areas of the highest endemicity in Indonesia and Papua New Guinea and contributed 9% of global PAR.
Conclusions and significance: This detailed depiction of spatially varying endemicity is intended to contribute to a much-needed paradigm shift towards geographically stratified and evidence-based planning for P. vivax control and elimination.
Conflict of interest statement
The authors have declared that no competing interests exist.
Figures

References
-
- Chitnis N, Schapira A, Smith DL, Smith T, Hay SI, et al... (2010) Mathematical modeling to support malaria control and elimination. Roll Back Malaria Progress and Impact Series, number 5. Geneva, Switzerland: Roll Back Malaria. 48 p.
-
- Feachem RGA, Phillips AA, Targett GA, on behalf of the Malaria Elimination Group, editors (2009) Shrinking the Malaria Map: a Prospectus on Malaria Elimination. San Francisco, U.S.A.: The Global Health Group, University of California - Santa Cruz Global Health Sciences. 187 p.
Publication types
MeSH terms
Grants and funding
LinkOut - more resources
Full Text Sources
Other Literature Sources
