. 2012 Sep 12:12:138.
doi: 10.1186/1471-2288-12-138.

Simulation evaluation of statistical properties of methods for indirect and mixed treatment comparisons

Affiliations

Simulation evaluation of statistical properties of methods for indirect and mixed treatment comparisons

Fujian Song et al. BMC Med Res Methodol. .

Abstract

Background: Indirect treatment comparison (ITC) and mixed treatment comparisons (MTC) have been increasingly used in network meta-analyses. This simulation study comprehensively investigated statistical properties and performances of commonly used ITC and MTC methods, including simple ITC (the Bucher method), frequentist and Bayesian MTC methods.

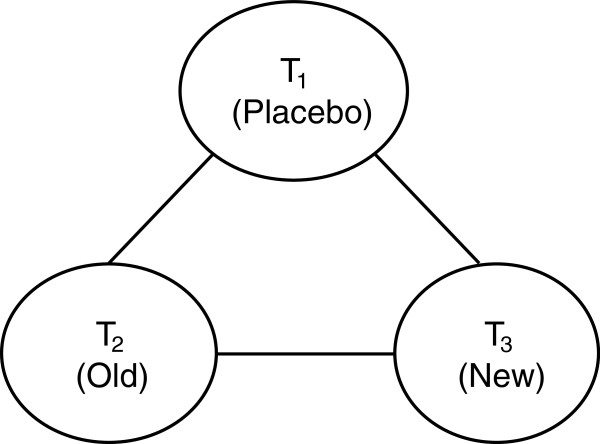
Methods: A simple network of three sets of two-arm trials with a closed loop was simulated. Different simulation scenarios were based on different number of trials, assumed treatment effects, extent of heterogeneity, bias and inconsistency. The performance of the ITC and MTC methods was measured by the type I error, statistical power, observed bias and mean squared error (MSE).

Results: When there are no biases in primary studies, all ITC and MTC methods investigated are on average unbiased. Depending on the extent and direction of biases in different sets of studies, ITC and MTC methods may be more or less biased than direct treatment comparisons (DTC). Of the methods investigated, the simple ITC method has the largest mean squared error (MSE). The DTC is superior to the ITC in terms of statistical power and MSE. Under the simulated circumstances in which there are no systematic biases and inconsistencies, the performances of MTC methods are generally better than the performance of the corresponding DTC methods. For inconsistency detection in network meta-analysis, the methods evaluated are on average unbiased. The statistical power of commonly used methods for detecting inconsistency is very low.

Conclusions: The available methods for indirect and mixed treatment comparisons have different advantages and limitations, depending on whether data analysed satisfies underlying assumptions. To choose the most valid statistical methods for research synthesis, an appropriate assessment of primary studies included in evidence network is required.


Figures

Figure 1
Figure 1
Network of simulated trials.
Figure 2
Figure 2
Mean squared error (MSE) by different comparison models (Note: baseline risk 20%; zero treatment effect; without systematic bias in trials; fix, fixed effect; ran, random-effects; Tau2 refers τ2).
Figure 3
Figure 3
Bias by different comparison methods (Note: selected simulation scenarios, baseline risk = 20%; τ2= 0.05; number of studies =3x20; random-effects analyses).
Figure 4
Figure 4
Type I error – proportion of significant results when true treatment effect is zero, impact of number of studies and assumed heterogeneity (Note: baseline risk =20%; fix, fixed effect; ran, random-effects; Tau2 refers τ2).
Figure 5
Figure 5
Statistical power to detect treatment effect (OR23 = 0.75), impact of number of studies and assumed heterogeneity (Note: Baseline risk =20%; fix, fixed effect; ran, random-effects; Tau2 refers τ2).
Figure 6
Figure 6
Estimated inconsistency (log ROR) – a selected simulation scenario (Note: true logROR = 0.223; baseline risk = 20%; number of studies =3x20; τ2= 0.10; Tau2 refers τ2).
Figure 7
Figure 7
Type I error for inconsistency detection: impact of heterogeneity and number of studies (Note: baseline risk =20%, true lnROR = 0; tau2 refers τ2; Freq-fix, frequentist fixed-effect; Freq-ran, frequentist random-effects; Bay-fix, Bayesian fixed-effect; Bay-ran, Bayesian random-effects).
Figure 8
Figure 8
Statistical power to detect inconsistency: impact of heterogeneity and number of studies (Note: baseline risk =20%, true lnROR = 0.223; tau2 refers τ2. Freq-fix, frequentist fixed-effect; Freq-ran, frequentist random-effects; Bay-fix, Bayesian fixed-effect; Bay-ran, Bayesian random-effects).

References

    1. Glenny AM, Altman DG, Song F, Sakarovitch C, Deeks JJ, D'Amico R, Bradburn M, Eastwood AJ. Indirect comparisons of competing interventions. Health Technol Assess. 2005;9(26):1–134. iii-iv. - PubMed
    1. Song F, Loke YK, Walsh T, Glenny AM, Eastwood AJ, Altman DG. Methodological problems in the use of indirect comparisons for evaluating healthcare interventions: a survey of published systematic reviews. BMJ. 2009;338:b1147. doi: 10.113/bmj.b1147. - DOI - PMC - PubMed
    1. Donegan S, Williamson P, Gamble C, Tudur-Smith C. Indirect comparisons: a review of reporting and methodological quality. PLoS One. 2010;5(11):e11054. doi: 10.1371/journal.pone.0011054. - DOI - PMC - PubMed
    1. Edwards SJ, Clarke MJ, Wordsworth S, Borrill J. Indirect comparisons of treatments based on systematic reviews of randomised controlled trials. Int J Clin Pract. 2009;63(6):841–854. doi: 10.1111/j.1742-1241.2009.02072.x. - DOI - PubMed
    1. Bucher HC, Guyatt GH, Griffith LE, Walter SD. The results of direct and indirect treatment comparisons in meta-analysis of randomized controlled trials. J Clin Epidemiol. 1997;50(6):683–691. doi: 10.1016/S0895-4356(97)00049-8. - DOI - PubMed

Publication types

LinkOut - more resources