
Phenotypic heterogeneity of genomic disorders and rare copy-number variants

Santhosh Girirajan et al. N Engl J Med. .

Erratum in

  • N Engl J Med. 2012 Dec 13;367(24):2362

Abstract

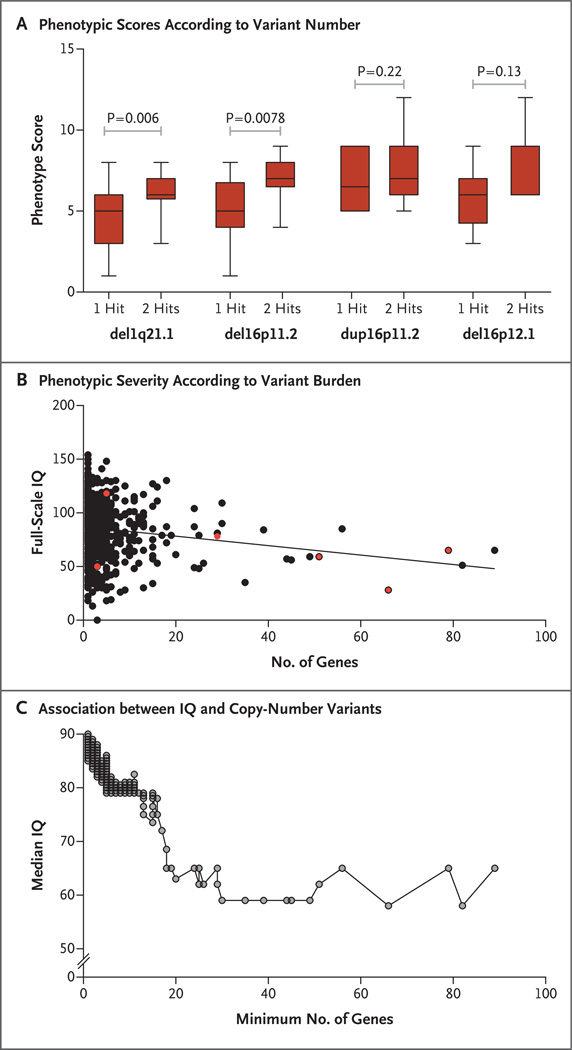
Background: Some copy-number variants are associated with genomic disorders with extreme phenotypic heterogeneity. The cause of this variation is unknown, which presents challenges in genetic diagnosis, counseling, and management.

Methods: We analyzed the genomes of 2312 children known to carry a copy-number variant associated with intellectual disability and congenital abnormalities, using array comparative genomic hybridization.

Results: Among the affected children, 10.1% carried a second large copy-number variant in addition to the primary genetic lesion. We identified seven genomic disorders, each defined by a specific copy-number variant, in which the affected children were more likely to carry multiple copy-number variants than were controls. We found that syndromic disorders could be distinguished from those with extreme phenotypic heterogeneity on the basis of the total number of copy-number variants and whether the variants are inherited or de novo. Children who carried two large copy-number variants of unknown clinical significance were eight times as likely to have developmental delay as were controls (odds ratio, 8.16; 95% confidence interval, 5.33 to 13.07; P=2.11×10(-38)). Among affected children, inherited copy-number variants tended to co-occur with a second-site large copy-number variant (Spearman correlation coefficient, 0.66; P<0.001). Boys were more likely than girls to have disorders of phenotypic heterogeneity (P<0.001), and mothers were more likely than fathers to transmit second-site copy-number variants to their offspring (P=0.02).

Conclusions: Multiple, large copy-number variants, including those of unknown pathogenic significance, compound to result in a severe clinical presentation, and secondary copy-number variants are preferentially transmitted from maternal carriers. (Funded by the Simons Foundation Autism Research Initiative and the National Institutes of Health.).


Figures

Figure 1
Figure 1. Inheritance Pattern of Copy-Number Variants and Frequency of Second-Site Variants Associated with a Genomic Disorder
In Panel A, the histogram shows the inheritance pattern of copy-number variants. Inheritance information for at least 5 children is shown. The asterisks denote the number of children for whom parental data were available: one asterisk, 5 to 10 children; two asterisks, 11 to 20 children; and three asterisks, more than 20 children. Most copy-number variants that were associated with syndromic disorders arose de novo, whereas the recently discovered variants associated with variable phenotypes were highly inherited. (A complete list of inheritance information for all 72 variants included in this study is provided in Table S12 in the Supplementary Appendix.) AS denotes Angelman syndrome, and PWS Prader–Willi syndrome. In Panel B, the histogram shows the incidence of large secondary copy-number variants in a representative set of variants associated with genomic disorders in samples obtained from 32,587 children with developmental delay or congenital anomalies. Results are displayed in the descending order of frequency of second-site variants. Frequencies of another large variant among controls (conditioned for deletions or duplications of >500 kb) and of 2 large variants (>500 kb) in the general control population (unconditioned) are indicated by black bars. An asterisk indicates a significant enrichment, as compared with controls who had either a deletion or duplication of the first-site variant. Only four disorders with significant enrichment are represented in this figure. To account for sex bias and the lack of control data on sex chromosomes, these data represent only autosomal second hits.
Figure 2
Figure 2. Sex Bias in Genomic Disorders Associated with Phenotypic Variation and the Correlation between the Inheritance of Variants and Incidence of Second-Site Variants
Panel A shows the proportion of boys with all 72 genomic disorders, including syndromic copy-number variants and those with variable features. Boys were more likely than girls to be affected with disorders of phenotypic heterogeneity (P<0.001 by the Mann–Whitney test). Panel B shows the percentage of inherited first-site copy-number variants and the incidence of rare variants at second sites for a representative set of genomic disorders. Each data point represents a genomic disorder. A strong correlation was observed (Spearman correlation coefficient, 0.68; P<0.001) when genomic disorders affecting more than five children were analyzed. The two categories of syndromic disorders and disorders with phenotypic heterogeneity cluster separately according to the percentage of inherited first-site variants. Seven genomic disorders are represented by a single data point at coordinates 0, 0, and two disorders by a single data point at 0, 5. (Additional information regarding variants that are not represented in this figure is provided in Fig. S16 in the Supplementary Appendix.) AS denotes Angelman syndrome, PWS Prader–Willi syndrome, and WBS Williams–Beuren syndrome.
Figure 3
Figure 3. Phenotypic Variation Associated with Additional Large Copy-Number Variants
Panel A shows phenotypic scores for four copy-number variants found in children with developmental delay, according to whether they had a single variant (1 hit) or an additional large variant (2 hits). The scores range from 0 to 14, with higher scores indicating extensive phenotypic heterogeneity. (Details of the scoring system are provided in Tables S13 and S14 in the Supplementary Appendix.) Phenotypic scores for children with multiple large variants were consistently higher than those for children with a single variant, indicating the increased prevalence of additional features of the disorder. The numbers of children with each variant were as follows: 1q21.1 (GJA8) deletion: 54 with a single variant and 10 with two large variants; 16p11.2 (TBX6) deletion: 16 with a single variant and 13 with two large variants; 16p11.2 (TBX6) duplication: 10 with a single variant and 8 with two large variants; and 16p12.1 (CDR2) deletion: 16 with a single variant and 7 with two large variants. The horizontal line within each box represents the median value; the bottom and top lines of the box represent the 25th and 75th percentiles, respectively; and the horizontal lines below and above the box represent the lowest and highest values, respectively. Panel B shows phenotypic severity as an outcome of the burden of rare copy-number variants for autism. The data points represent the analysis of full-scale IQ (y axis) in the context of the number of genes (x axis) disrupted by rare copy-number variants. Red data points represent samples with two large (>500-kb) variants. The trend line running through the data points shows correlation. Panel C shows the association between median IQ and the minimum number of genes disrupted by copy-number variants, indicating a striking reduction in median IQ with an increasing number of affected genes. In probands with 18 or more affected genes, the median full-scale IQ drops below the threshold for intellectual disability (70 points) and is significantly reduced, as compared with probands with fewer than 18 affected genes (P = 0.002 by the Wilcoxon rank-sum test).

Comment in

  • The variability of genetic disease.
    Brunner HG. Brunner HG. N Engl J Med. 2012 Oct 4;367(14):1350-2. doi: 10.1056/NEJMe1209699. Epub 2012 Sep 12. N Engl J Med. 2012. PMID: 22970918 No abstract available.

References

    1. Andrieux J, Dubourg C, Rio M, et al. Genotype-phenotype correlation in four 15q24 deleted patients identified by array-CGH. Am J Med Genet A. 2009;149A:2813–2819. - PMC - PubMed
    1. Antonell A, Del Campo M, Magano LF, et al. Partial 7q11.23 deletions further implicate GTF2I and GTF2IRD1 as the main genes responsible for the Williams-Beuren syndrome neurocognitive profile. J Med Genet. 2010;47:312–320. - PubMed
    1. Girirajan S, Vlangos CN, Szomju BB, et al. Genotype-phenotype correlation in Smith-Magenis syndrome: evidence that multiple genes in 17p11.2 contribute to the clinical spectrum. Genet Med. 2006;8:417–427. - PubMed
    1. Liburd N, Ghosh M, Riazuddin S, et al. Novel mutations of MYO15A associated with profound deafness in consanguineous families and moderately severe hearing loss in a patient with Smith-Magenis syndrome. Hum Genet. 2001;109:535–541. - PubMed
    1. Sarasua SM, Dwivedi A, Boccuto L, et al. Association between deletion size and important phenotypes expands the genomic region of interest in Phelan-McDermid syndrome (22q13 deletion syndrome) J Med Genet. 2011;48:761–766. - PubMed

Publication types