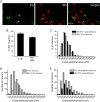
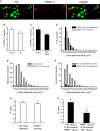
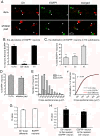
. 2012 Sep 12:8:66.
doi: 10.1186/1744-8069-8-66.

Expression of the transient receptor potential channels TRPV1, TRPA1 and TRPM8 in mouse trigeminal primary afferent neurons innervating the dura

Affiliations

Expression of the transient receptor potential channels TRPV1, TRPA1 and TRPM8 in mouse trigeminal primary afferent neurons innervating the dura

Dongyue Huang et al. Mol Pain. .

Abstract

Background: Migraine and other headache disorders affect a large percentage of the population and cause debilitating pain. Activation and sensitization of the trigeminal primary afferent neurons innervating the dura and cerebral vessels is a crucial step in the "headache circuit". Many dural afferent neurons respond to algesic and inflammatory agents. Given the clear role of the transient receptor potential (TRP) family of channels in both sensing chemical stimulants and mediating inflammatory pain, we investigated the expression of TRP channels in dural afferent neurons.

Methods: We used two fluorescent tracers to retrogradely label dural afferent neurons in adult mice and quantified the abundance of peptidergic and non-peptidergic neuron populations using calcitonin gene-related peptide immunoreactivity (CGRP-ir) and isolectin B4 (IB4) binding as markers, respectively. Using immunohistochemistry, we compared the expression of TRPV1 and TRPA1 channels in dural afferent neurons with the expression in total trigeminal ganglion (TG) neurons. To examine the distribution of TRPM8 channels, we labeled dural afferent neurons in mice expressing farnesylated enhanced green fluorescent protein (EGFPf) from a TRPM8 locus. We used nearest-neighbor measurement to predict the spatial association between dural afferent neurons and neurons expressing TRPA1 or TRPM8 channels in the TG.

Results and conclusions: We report that the size of dural afferent neurons is significantly larger than that of total TG neurons and facial skin afferents. Approximately 40% of dural afferent neurons exhibit IB4 binding. Surprisingly, the percentage of dural afferent neurons containing CGRP-ir is significantly lower than those of total TG neurons and facial skin afferents. Both TRPV1 and TRPA1 channels are expressed in dural afferent neurons. Furthermore, nearest-neighbor measurement indicates that TRPA1-expressing neurons are clustered around a subset of dural afferent neurons. Interestingly, TRPM8-expressing neurons are virtually absent in the dural afferent population, nor do these neurons cluster around dural afferent neurons. Taken together, our results suggest that TRPV1 and TRPA1 but not TRPM8 channels likely contribute to the excitation of dural afferent neurons and the subsequent activation of the headache circuit. These results provide an anatomical basis for understanding further the functional significance of TRP channels in headache pathophysiology.


Figures
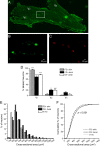
Figure 1
Figure 1
Localization and size distribution of the TG neurons innervating the dura and periorbital skin. (A) Representative image of a TG section showing FG-labeled (FG+) dural afferent neurons. Note that the labeled neurons are distributed predominantly within the V1 division and to some extent in the V2 division. (B) High-magnification image of the region indicated in (A). (C) Representative image of DiI-labeled (DiI+) dural afferent neurons. (D) The distributions of FG+ and DiI+ in the skin and dural afferent neurons from the three TG divisions (n = 3–4 mice in each group; on average, 200 labeled neurons from each mouse were counted). The majority of labeled neurons are distributed in the V1 and V2 divisions (one-way ANOVA with post hoc Bonferroni test, *** p < 0.001, V1 versus V2 or V3 distribution in each group; #p < 0.05, ###p < 0.001, V2 versus V3 distribution in each group). (E) Histogram of the size distributions of total TG neurons in the V1/V2 divisions, FG+ skin afferent neurons, and FG+ dural afferent neurons (n = 2316, 600 and 2208 neurons pooled from three mice, respectively). (F) Cumulative distributions of the cross-sectional areas of total TG neurons in the V1/V2 divisions, FG+ skin afferent neurons, and FG+ dural afferent neurons (the same neurons as in E). The sizes of dural afferent neurons are significantly larger than those of the skin afferents and the V1/V2 TG neurons (p < 0.001, Kruskal-Wallis ANOVA with Dunn’s post hoc test).
Figure 2
Figure 2
Retrograde labeling of dural and facial skin afferent neurons from the same mouse. Representative images of a TG section showing DiI+ dural afferent neurons (A) and FG+ neurons innervating the periorbital skin (B). Note that there is no overlap between the dural and skin afferent neurons as seen in the merged image (C) A total of 425 dural and 360 skin afferent neurons from three mice were counted, respectively).
Figure 3
Figure 3
The distribution of dural afferent neurons expressing the neuropeptide CGRP. (A) Representative images of TG sections containing FG+ or DiI+ dural afferent neurons and neurons exhibiting CGRP-ir. Arrowheads indicate double-labeled FG+/CGRP+ and DiI+/CGRP+ dural afferent neurons. (B) The abundances of CGRP+ neurons in the V1/V2 divisions of the TG, in the FG+ skin afferent neurons, and in the FG+ or DiI+ dural afferent neurons (n = 3 mice in each group; *** p < 0.001, two-tailed t-test). On average, 685 V1/V2 neurons from each mouse were counted in each group. On average, 296 FG+ skin afferent neurons, 233 FG+ dural afferents, and 285 DiI+ dural afferent neurons were counted from each mouse. (C) The size distribution of the CGRP+ dural afferent neurons (filled bars, n = 99 neurons pooled from three mice) is similar to that of the CGRP+ neurons in the V1/V2 divisions of the TG (open bars, n = 661 neurons pooled from three mice, p = 0.7, Mann–Whitney U test). (D) The size distribution of the CGRP+ neurons (open bars, the same neurons as in C) and total neurons in the V1/V2 divisions of the TG (grey bars, n = 2041 neurons pooled from three mice). (E) The size distribution of the CGRP+ dural afferent neurons (filled bars, the same neurons as in C) and total FG+ dural afferents (grey bars, n = 700 neurons pooled from three mice).
Figure 4
Figure 4
The distribution of IB4+neurons in the V1/V2TG divisions and the dural afferent population. (A) Representative images of a TG section containing FG+ dural afferent neurons and IB4-labeled neurons. Arrowheads indicate neurons that are both FG+ and IB4+. (B) The percentages of V1/V2 TG neurons and FG+ dural afferent neurons that are IB4+ (n = 3 mice; on average, 500 V1/V2 neurons and 235 FG+ neurons were counted from each mouse; * p < 0.05, two-tailed t-test). (C) The size distributions of the IB4+/FG+ dural afferent neurons (black bars, n = 267 neurons pooled from three mice) are similar to the distributions of the IB4+ neurons in the V1/V2 divisions of the TG (white bars, n = 686 neurons pooled from three mice, p = 0.1, Mann–Whitney U test). (D) The sizes of IB4+ neurons (open bars, the same neurons as in C) are significantly smaller than those of the V1/V2 neurons (grey bars, n = 1499 neurons pooled from three mice, p < 0.001, Mann–Whitney U test). (E) The sizes of IB4+/FG+ dural afferents (black bars, the same neurons as in C) are significantly smaller than those of the total FG+ dural afferent neurons (grey bars, n = 704 neurons pooled from three mice, p < 0.001, Mann–Whitney U test).
Figure 5
Figure 5
The distribution of neurons expressing TRPV1 channels in the TG and dural afferent neuron populations. (A) Representative images of a TG section containing FG+ dural afferent neurons and neurons exhibiting TRPV1-ir. Arrowheads indicate neurons that are both FG+ and TRPV1+. (B) The percentage of TRPV1+ TG neurons in the V1/V2 and V3 divisions (n = 3 mice; on average, 730 V1/V2 neurons and 500 V3 neurons were counted from each mouse; *** p < 0.001, two-tailed t-test). (C) The percentages of V1/V2 TG neurons (the same data set as in B) and FG+ dural afferent neurons that are TRPV1+ (n = 3 mice, on average, 213 FG+ neurons were counted from each mouse; * p < 0.05, two-tailed t-test). (D) The size distribution of TRPV1+/FG+ dural afferent neurons (n = 151 neurons pooled from three mice) are similar to the TRPV1+ neurons in the V1/V2 divisions of the TG (n = 679 neurons pooled from three mice, p = 0.1, Mann–Whitney U test). (E) The sizes of TRPV1+ neurons (the same neurons as in D) are significantly smaller than those of the neurons in the V1/V2 divisions of the TG (n = 2189 neurons pooled from three mice, p < 0.001, Mann–Whitney U test). (F) The sizes of TRPV1+/FG+ dural afferents (the same neurons as in D) are significantly smaller than those of the total FG+ dural afferent neurons (n = 638 neurons pooled from three mice, p < 0.001, Mann–Whitney U test).
Figure 6
Figure 6
The distribution of neurons expressing TRPA1 channels in the TG and dural afferent neurons. (A) Representative images of a TG section containing a FG+/TRPA1+ dural afferent neuron (indicated by the arrowheads; scale bar: 20 μm). (B) The percentage of TRPA1+ TG neurons in the V1/V2 and V3 divisions (n = 3 mice; on average, 576 V1/V2 neurons and 428 V3 neurons were counted from each mouse). (C) The percentages of TRPA1+ V1/V2 TG neurons (the same data as in B) and FG+ dural afferent neurons (n = 3 mice, on average, 206 FG+ neurons were counted from each mouse). (D) The size distribution of TRPA1+/FG+ dural afferent neurons are significantly smaller than those of the TRPA1+ neurons in the V1/V2 divisions of the TG (n = 35 and 130 neurons pooled from three mice, respectively; p < 0.05, Mann–Whitney U test). (E) The sizes of TRPA1+ neurons (the same neurons as in D) are significantly smaller than those of the neurons in the V1/V2 divisions of the TG (n = 1729 neurons pooled from three mice, p < 0.001, Mann–Whitney U test). (F) The sizes of TRPA1+/FG+ dural afferents (the same neurons as in D) are significantly smaller than those of the total FG+ dural afferent neurons (n = 620 neurons pooled from three mice, p < 0.001, Mann–Whitney U test). (G) Nearest-neighbor measurement shows that both FG+ dural afferent neurons and TRPA1+ neurons are randomly distributed in the TG (n = 130 TRPA1+ neurons and 620 FG+ dural afferent neurons from 3 mice, the same cells as in D and F). (H) A modified nearest-neighbor measurement shows that TRPA1+ neurons are clustered around some, but not all, of the FG+ dural afferent neurons (the same neurons as in G).
Figure 7
Figure 7
The dural afferent neuron population lacks TRPM8-expressing neurons. (A) Representative images of TG sections from TRPM8EGFPf/+ mice following dural DiI application or intradermal DiI injection at the whisker pad. The thick and thin arrowheads indicate DiI+ and EGFPf+ neurons, respectively. The arrows in the lower row indicate a DiI+ skin afferent neuron that is also EGFPf+. (B) The percentage of EGFPf+ neurons that are in the V1/V2 TG, the V3 TG and the DiI+ dural afferent neuron population (n = 3 mice, on average, 480 V1/V2 neurons, 472 V3, neurons and 206 DiI+ neurons were counted from each mouse; *** p < 0.001, two-tailed t-test, V1/V2 group versus DiI+ dura group). (C) The fraction of EGFPf+ neurons in the three TG divisions (n = 4 mice; on average, 1210 EGFPf+ neurons were counted from each mouse; *** p < 0.001, one-way ANOVA with post hoc Bonferroni test, all compared with the V3 distribution). (D) The percentage of EGFPf+ V1/V2 TG neurons and DiI+ neurons innervating the skin over the whisker pad (n = 4 mice, on average, 448 V1/V2 neurons and 76 DiI+ neurons were counted from each mouse). (E) The sizes of EGFPf+ neurons (n = 363 neurons pooled from five mice) are significantly smaller than those of the neurons in the V1/V2 divisions of the TG (n = 2403 neurons pooled from 5 mice, p < 0.001, Mann–Whitney U test). (F) Cumulative distributions of the cross-sectional areas of the total TG neuron populations in the V1/V2 divisions (the same neurons as in E), the EGFPf V1/V2 TG neurons (n = 2040 neurons pooled from five mice), and the FG+ dural afferent neurons (the same neurons as in Figure 1F). The sizes of EGFPf V1/V2 TG neurons are comparable to those of the dural afferent neurons, and both populations are significantly larger than the total V1/V2 neurons (p < 0.001, Kruskal-Wallis ANOVA with Dunn’s post hoc test). (G) Nearest-neighbor measurement shows that both DiI+ dural afferent neurons and EGFPf+ neurons are randomly distributed in the TG (n = 182 EGFPf+ neurons and 619 DiI+ dural afferent neurons from three mice, the same neurons as in B). (H) A modified nearest-neighbor measurement shows that the EGFPf+ neurons are located farther away from the dural afferent population than would be predicted by random association, and vice versa (the same neurons as in G).
Figure 8
Figure 8
Overlay of the cumulative distributions of the TRPV1+, TRPA1+and TRPM8-expressing neurons in the V1/V2divisions of the TG. Cumulative distribution of the cross-sectional areas of the total TG neurons in the V1/V2 divisions (dashed gray line, the same neurons as in Figure 1F), the TRPV1+ neurons (solid black line, the same neurons as in Figure 5E), the TRPA1+ neurons (red line, the same neurons as in Figure 6E), and the TRPM8-expressing neurons (dashed green line, the same neurons as in Figure 7E). A Kruskal-Wallis ANOVA with Dunn’s post hoc test reveals that the sizes of TRPV1+ neurons are the smallest of the three populations of TG neurons (p < 0.001 and p < 0.05 compared with the TRPA1+ and EGFPf+ groups, respectively). In contrast, the sizes of TRPA1+ neurons are significantly larger than those of the TRPV1+ and TRPM8-expressing neurons (p < 0.001 and p < 0.05, respectively).

Similar articles

Cited by

References

    1. Goadsby PJ, Charbit AR, Andreou AP, Akerman S, Holland PR. Neurobiology of migraine. Neuroscience. 2009;161:327–341. doi: 10.1016/j.neuroscience.2009.03.019. - DOI - PubMed
    1. Moskowitz MA. Pathophysiology of headache–past and present. Headache. 2007;47(Suppl 1):S58–S63. - PubMed
    1. Strassman AM, Raymond SA, Burstein R. Sensitization of meningeal sensory neurons and the origin of headaches. Nature. 1996;384:560–564. doi: 10.1038/384560a0. - DOI - PubMed
    1. Basbaum AI, Bautista DM, Scherrer G, Julius D. Cellular and molecular mechanisms of pain. Cell. 2009;139:267–284. doi: 10.1016/j.cell.2009.09.028. - DOI - PMC - PubMed
    1. Patapoutian A, Tate S, Woolf CJ. Transient receptor potential channels: targeting pain at the source. Nat Rev Drug Discov. 2009;8:55–68. doi: 10.1038/nrd2757. - DOI - PMC - PubMed

Publication types

LinkOut - more resources