. 2012 Oct 7;57(19):6103-24.
doi: 10.1088/0031-9155/57/19/6103. Epub 2012 Sep 13.

An imaging-based stochastic model for simulation of tumour vasculature

Affiliations

An imaging-based stochastic model for simulation of tumour vasculature

Vikram Adhikarla et al. Phys Med Biol. .

Abstract

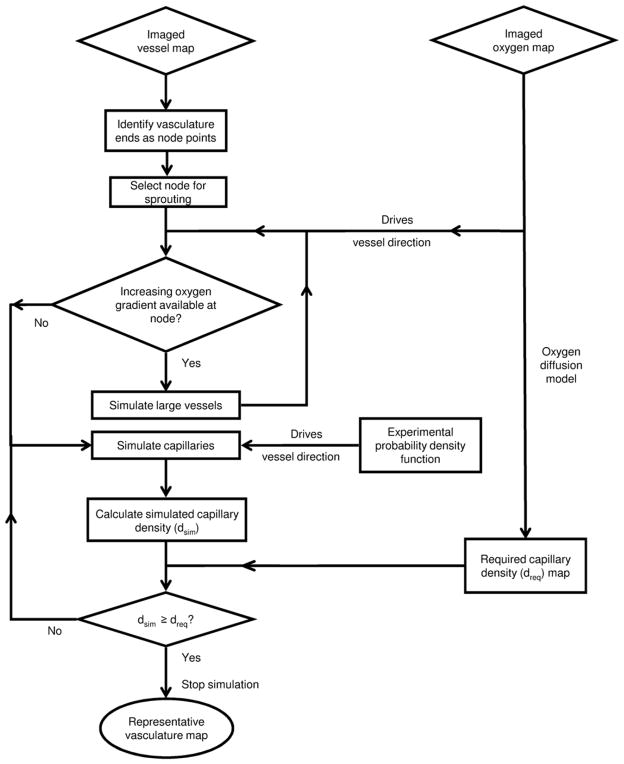
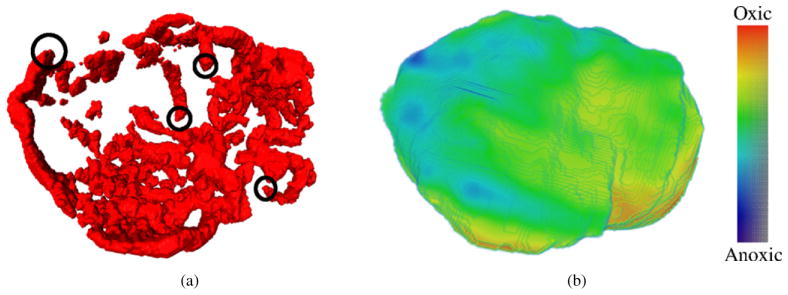
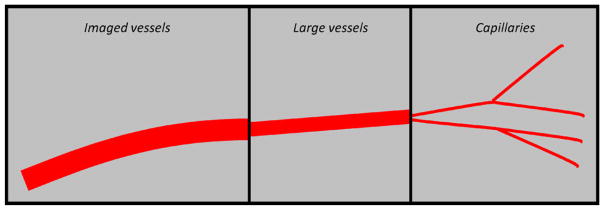
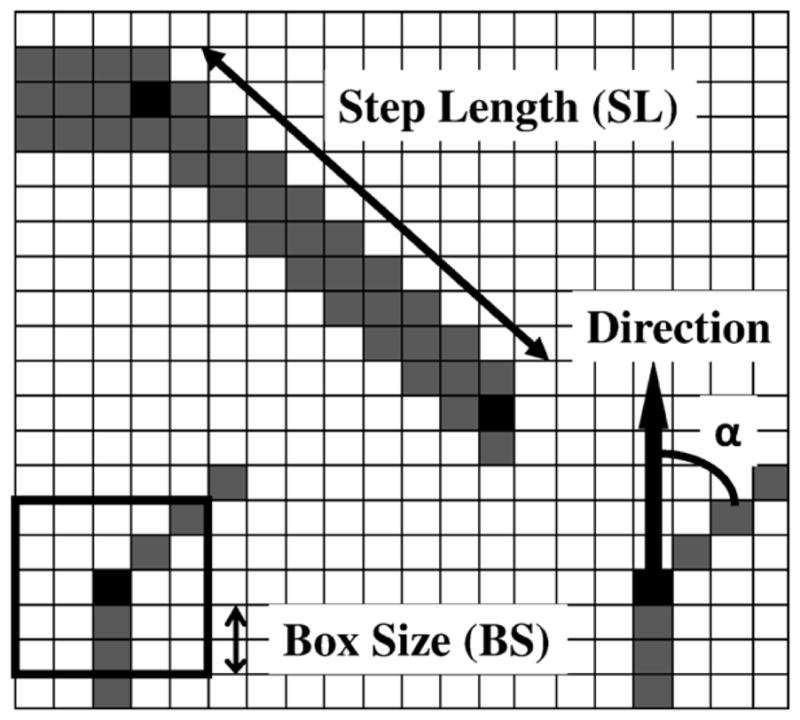
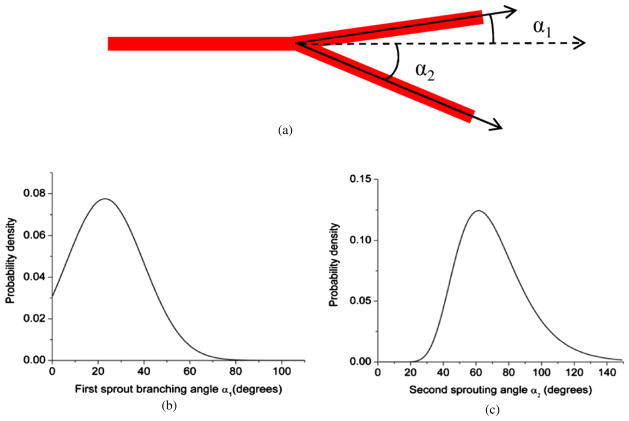
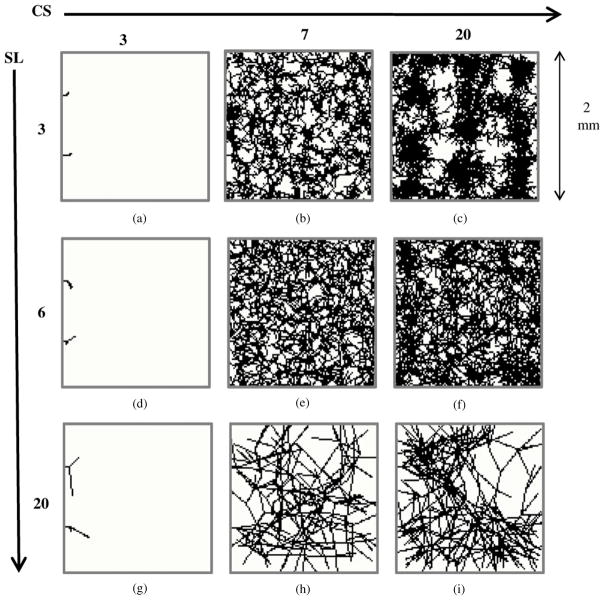
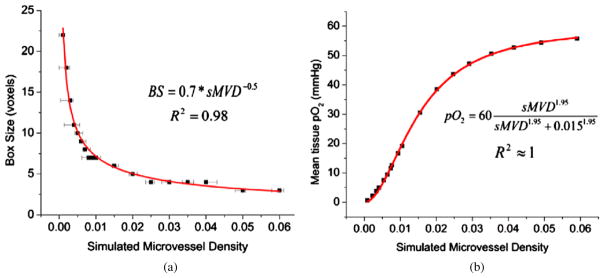
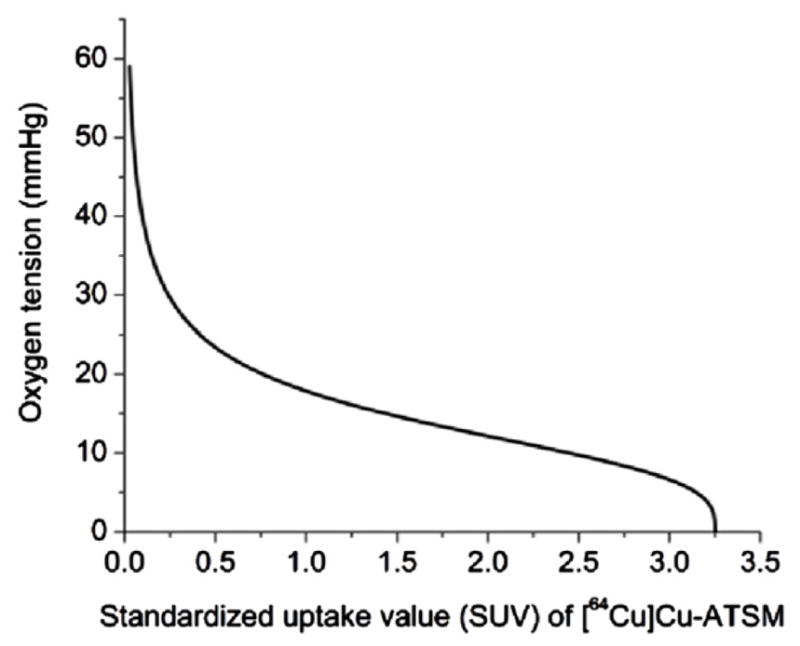
A mathematical model which reconstructs the structure of existing vasculature using patient-specific anatomical, functional and molecular imaging as input was developed. The vessel structure is modelled according to empirical vascular parameters, such as the mean vessel branching angle. The model is calibrated such that the resultant oxygen map modelled from the simulated microvasculature stochastically matches the input oxygen map to a high degree of accuracy (R(2) ≈ 1). The calibrated model was successfully applied to preclinical imaging data. Starting from the anatomical vasculature image (obtained from contrast-enhanced computed tomography), a representative map of the complete vasculature was stochastically simulated as determined by the oxygen map (obtained from hypoxia [(64)Cu]Cu-ATSM positron emission tomography). The simulated microscopic vasculature and the calculated oxygenation map successfully represent the imaged hypoxia distribution (R(2) = 0.94). The model elicits the parameters required to simulate vasculature consistent with imaging and provides a key mathematical relationship relating the vessel volume to the tissue oxygen tension. Apart from providing an excellent framework for visualizing the imaging gap between the microscopic and macroscopic imagings, the model has the potential to be extended as a tool to study the dynamics between the tumour and the vasculature in a patient-specific manner and has an application in the simulation of anti-angiogenic therapies.


Figures

Figure 1
Figure 1
Model workflow demonstrating the algorithm to obtain the representative vasculature map taking the imaged vasculature and oxygen map as input.
Figure 2
Figure 2
Example input parameters for the model. (a) Vessel map imaged by the CE-CT scan of a mouse. Examples of vessel ends (initial nodes) are marked with black circles. (b) The oxygen map derived from the hypoxia map imaged using [64Cu]Cu-ATSM PET scan.
Figure 3
Figure 3
Vasculature hierarchy. The three different types of vessels used to simulate the vasculature.
Figure 4
Figure 4
Tissue matrix showing the parameters used to simulate the vasculature. The step length is the distance a vessel sprouts in a single simulation step. The box size is the variable used to calculate the density at any point. α is the angle from the original direction a vessel sprouts.
Figure 5
Figure 5
Probability density functions for the branching angle α. (a) The two branching angles are created when a parent vessel sprouts into two daughter vessels. (b), (c) The probability density functions adapted from the experimental observations of Op Den Buijs et al (2006). These probability density functions are used in a Monte Carlo algorithm to generate the angle for vessel sprouting (α).
Figure 6
Figure 6
Dependence of vasculature on the step length and box size. Projections of the three-dimensional vessel matrix (100 × 100 × 100 voxel cube) on a two-dimensional plane are shown. Note that these are not cross-sections through the matrix, which would appear to be much sparser. The step length and box sizes attributed to each image have been shown to the left and the top of the figure, respectively. The simulated microvessel density (sMVD) targeted for each scenario was 1%. The achieved sMVDs attributed to each scenario is as follows—(a) 0%, (b) 0.94%, (c) 1.87%, (d) 0%, (e) 1.01%, (f) 1.25%, (g) 0%, (h) 0.66%, (i) 0.88%. Proper calibration of SL and BS is required to ensure that there is adequate sprouting and the vessels do not cluster around each other, or develop a rigid structure.
Figure 7
Figure 7
Mathematical relations obtained for vasculatures simulated using parameters listed in table 2. (a) Calibration of BS with sMVD. This relation is used to simulate the vessel structure once the sMVD map has been derived. The data points signify the density targeted, while the error bars signify the minimum and maximum density achieved from a hundred simulation runs. (b) Mean tissue pO2 as a function of sMVD. This relation is used to convert the input pO2 map to a map of required sMVD.
Figure 8
Figure 8
Illustration of the sigmoid relationship between the [64Cu]Cu-ATSM SUV and pO2. This relationship was used to convert the imaged [64Cu]Cu-ATSM uptake to a map of tissue oxygen tension.
Figure 9
Figure 9
Simulation of vasculatures of uniform capillary densities. Three-dimensional renderings of the simulated vasculature along with the cross-sections through their respective matrices for three different scenarios are shown. (a) and (d) sMVD = 1.03%. (b) and (e) sMVD = 2.03%. (c) and (f) sMVD = 2.95%. Even though the three-dimensional renderings look dense, the sparseness of the matrices can be seen from the cross-sections of the matrices.
Figure 10
Figure 10
Model testing on a heterogeneous oxygen distribution (1–25 mmHg). The capillaries can be observed to cover the tissue matrix with the density dictated by the oxygen map. More vessels can be seen in a region of higher oxygen tension.
Figure 11
Figure 11
Verification and sensitivity study of oxygen maps. (a) A cross-section through the input oxygen map (range 1–25 mmHg). (b) Cross-section through the corresponding oxygen map simulated (an average of 300 runs) with each voxel averaged over its corresponding cube of volume V, volume V being the volume around any given voxel over which the sMVD of the voxel is defined. (c) Voxel wise correlation over the entire volume of the input and simulated maps (averaged over V) after different number of simulation runs. There are two curves each for the 1, 10 and 50 run cases depicting the minimum and maximum values of pO2 obtained. The shaded region represents the scatter plot for 300 runs. (d) pO2 distribution across the cross-section for a single run. (e)–(g) Average pO2 distribution across the cross-section for 10, 50 and 300 runs, respectively. (h)–(k) pO2 of each voxel averaged over the corresponding cubic volume V for 1, 10, 50 and 300 runs, respectively.
Figure 12
Figure 12
Simulation of vasculature with imaging data. (a) Imaged vasculature from CT superimposed on top of the Cu-ATSM-PET hypoxia map. (b) Simulated representative map of the vasculature superimposed on top of the Cu-ATSM hypoxia map. (c) A cross-section through the input vasculature (white specks) overlaid on top of the cross-section through the hypoxia map. The hypoxia map is shown at the resolution of the PET scan. (d) The same cross-sections through the simulated hypoxia and vasculature maps. (e) A magnified section of the simulated hypoxia and vasculature maps at the scale of the simulated vasculature. Hypoxia can be seen distant to the vasculature. An important point to note here is the issue of computational limitation as has been discussed earlier (section 3.2). The width of the box in (d) is 3.3 mm. But since the vasculature simulations have been performed at a voxel resolution of 20 μm instead of 60 μm, the actual box width on the vasculature simulation scale corresponds to 1.1 mm. (f) PET voxel level correlation of the input and simulated hypoxia maps performed for a single run when a subsection of the tumour was scaled up to the resolution of 20 μm.

Similar articles

Cited by

References

    1. Anderson A, Chaplain M. Continuous and discrete mathematical models of tumor-induced angiogenesis. Bull Math Biol. 1998;60:857–99. - PubMed
    1. Atuegwu NC, Arlinghaus LR, Li X, Welch EB, Chakravarthy BA, Gore JC, Yankeelov TE. Integration of diffusion-weighted MRI data and a simple mathematical model to predict breast tumor cellularity during neoadjuvant chemotherapy. Magn Reson Med. 2011;66:1689–96. - PMC - PubMed
    1. Baish J, Gazit Y, Berk D, Nozue M, Baxter L, Jain R. Role of tumor vascular architecture in nutrient and drug delivery: an invasion percolation-based network model. Microvasc Res. 1996;51:327–46. - PubMed
    1. Baish J, Jain R. Fractals and cancer. Cancer Res. 2000;60:3683–8. - PubMed
    1. Basciano C, Kleinstreuer C, Kennedy A, Dezarn W, Childress E. Computer modeling of controlled microsphere release and targeting in a representative hepatic artery system. Ann Biomed Eng. 2010;38:1862–79. - PubMed

Publication types