. 2012 Sep 12;9(1):19.
doi: 10.1186/1742-4933-9-19.

Uremia causes premature ageing of the T cell compartment in end-stage renal disease patients

Affiliations

Uremia causes premature ageing of the T cell compartment in end-stage renal disease patients

Ruud Wj Meijers et al. Immun Ageing. .

Abstract

Background: End-stage renal disease (ESRD) patients treated with renal replacement therapy (RRT) have premature immunologically aged T cells which may underlie uremia-associated immune dysfunction. The aim of this study was to investigate whether uremia was able to induce premature ageing of the T cell compartment. For this purpose, we examined the degree of premature immunological T cell ageing by examining the T cell differentiation status, thymic output via T cell receptor excision circle (TREC) content and proliferative history via relative telomere length in ESRD patients not on RRT.

Results: Compared to healthy controls, these patients already had a lower TREC content and an increased T cell differentiation accompanied by shorter telomeres. RRT was able to enhance CD8+ T cell differentiation and to reduce CD8+ T cell telomere length in young dialysis patients. An increased differentiation status of memory CD4+ T cells was also noted in young dialysis patients.

Conclusion: Based on these results we can conclude that uremia already causes premature immunological ageing of the T cell system and RRT further increases immunological ageing of the CD8+ T cell compartment in particular in young ESRD patients.


Figures
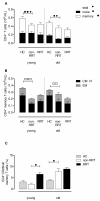
Figure 1
Figure 1
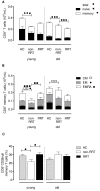
CD4+T cell phenotype and differentiation status. Using a whole blood staining, the phenotype and differentiation status of CD4+ T cells were determined in HC and ESRD patients not on RRT or receiving RRT. The absolute number of CD4+ T cells of young (age: <50 years) and old (age: ≥50 years) HC and these ESRD patients was dissected into a naïve (closed bars) and memory (open bars) compartment (A). Next, the composition of the memory compartment (CM in black and EM in grey bars) of CD4+ T cells is given for young and old HC and ESRD patients on RRT or not (B). In addition, we also determined the percentage memory CD4+ T cells lacking CD28 (i.e. CD28null) on their cell surface as another marker for T cell differentiation for HC (grey bars) and ESRD patients not on RRT (white bars) or receiving RRT (black bars) (C). Bars represent the means + SEM and statistically significant differences between the groups are shown (one symbol: p < 0.05, two symbols: p < 0.01, three symbols: p < 0.001).
Figure 2
Figure 2
CD8+T cell phenotype and differentiation status. Using a whole blood staining, the phenotype and differentiation status of CD8+ T cells were determined in HC and ESRD patients not on RRT or receiving RRT. The absolute number of CD8+ T cells of young (age: <50 years) and old (age: ≥50 years) HC and these ESRD patients was dissected into a naïve (closed bars) and memory (open bars) compartment (A). Next, the composition of the memory compartment (CM in black, EM in grey and EMRA in white bars) of CD8+ T cells is given for young and old HC and ESRD patients on RRT or not (B). In addition, we also determined the percentage memory CD8+ T cells lacking CD28 (i.e. CD28null) on their cell surface as another marker for T cell differentiation for HC (grey bars) and ESRD patients not on RRT (white bars) or receiving RRT (black bars) (C). Bars represent the means + SEM and statistically significant differences between the groups are shown (one symbol: p < 0.05, two symbols: p < 0.01, three symbols: p < 0.001).
Figure 3
Figure 3
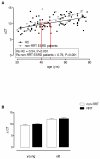
Quantification of the TREC content by quantitative PCR. The threshold cycle (Ct) is the number of amplification cycles needed to detect the TRECs and is a relative measure, inversely related with the concentration of TRECs. Control for DNA input was done by performing a quantitative PCR (qPCR) for albumin and the difference between the Ct for TRECs and the Ct for albumin was calculated (ΔCt). The ΔCt, indicative for TREC content, was determined of HC (straight line) and ESRD patients not on RRT (dotted line) and lines were compared using a linear regression analysis (p < 0.05 for the difference between lines for ESRD patients not on RRT and HC). The lines in (A) mark the discrepancy between the calendar age (i.e. 40 years) of a non-RRT patient and the immunological age, by extrapolation of the value for the deltaCT (TREC content) to the HC regression line. In addition, Spearmans Rho correlation coefficients (Rs) were calculated for HC and ESRD patients not on RRT to determine the strength of the association between TREC content (calculated as ΔCt) and age. Age is depicted on the X-axis whereas on the Y-axis the ΔCt value for TREC content is displayed. Next, the effect of RRT on the TREC content (B) was analyzed by dissecting the ESRD patients into a young (<50 years) and old (≥50 years) group and either not (white bars) or receiving (black bars) RRT. Bars represent means + SEM.
Figure 4
Figure 4
Relative telomere length of CD4+and CD8+T cells. The relative telomere length (RTL) of the CD4+ (A) and CD8+ (C) T cells is determined of HC (straight line) and ESRD patients not on RRT (dotted line) and lines were compared using a linear regression analysis i.e. p < 0.05 and p = 0.07 when comparing the differences between HC and non-RRT patients with respect to CD4+ RTL and CD8+ RTL respectively. The lines in A and C highlight the discrepancy between the calendar age (i.e. 40 years) of a non-RRT patient and the immunological age, by extrapolation of the value for the CD4+ and CD8+ RTL to the HC regression line, respectively. In addition, Spearmans Rho correlation coefficients (Rs) were calculated for HC and ESRD patients not on RRT to determine the strength of the association between RTL and age. Age is depicted on the X-axis and the RTL on the Y-axis. The effect of RRT on the RTL of CD4+ (B) as well as CD8+ (D) T cells was analyzed by dissecting the ESRD patients into a young (<50 years) and old (≥50 years) group and either not receiving RRT (white bars) or receiving RRT (black bars). Bars represent means + SEM. Statistical differences between the groups are shown (* p < 0.05).

Similar articles

Cited by

References

    1. Betjes MG, Langerak AW, van der Spek A, de Wit EA, Litjens NH. Premature aging of circulating T cells in patients with end-stage renal disease. Kidney Int. 2011;80:208–217. doi: 10.1038/ki.2011.110. - DOI - PubMed
    1. Litjens NH, van Druningen CJ, Betjes MG. Progressive loss of renal function is associated with activation and depletion of naive T lymphocytes. ClinImmunol. 2006;118:83–91. - PubMed
    1. Litjens NH, Huisman M, van den Dorpel M, Betjes MG. Impaired immune responses and antigen-specific memory CD4+ T cells in hemodialysis patients. J Am Soc Nephrol. 2008;19:1483–1490. doi: 10.1681/ASN.2007090971. - DOI - PMC - PubMed
    1. Verkade MA, de WJ V, Klepper M, Vaessen LM, Weimar W, Betjes MG. Peripheral blood dendritic cells and GM-CSF as an adjuvant for hepatitis B vaccination in hemodialysis patients. Kidney Int. 2004;66:614–621. doi: 10.1111/j.1523-1755.2004.00781.x. - DOI - PubMed
    1. Vanholder R, Ringoir S. Infectious morbidity and defects of phagocytic function in end-stage renal disease: a review. J Am Soc Nephrol. 1993;3:1541–1554. - PubMed