

Calibrated BOLD using direct measurement of changes in venous oxygenation
- PMID: 22971549
- PMCID: PMC3485568
- DOI: 10.1016/j.neuroimage.2012.08.045
Calibrated BOLD using direct measurement of changes in venous oxygenation
Abstract
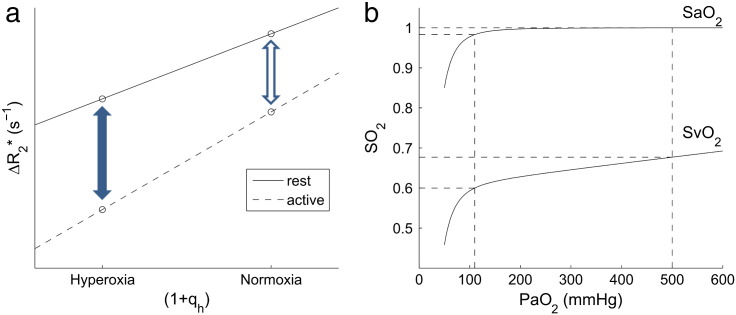
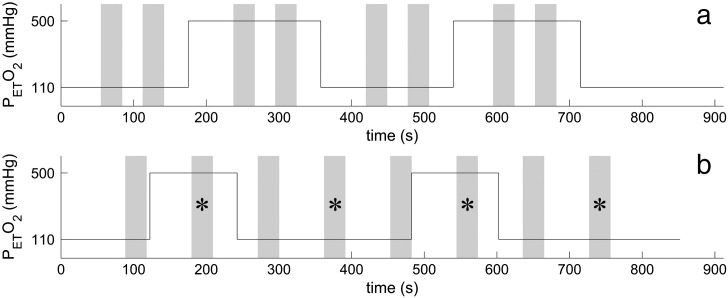
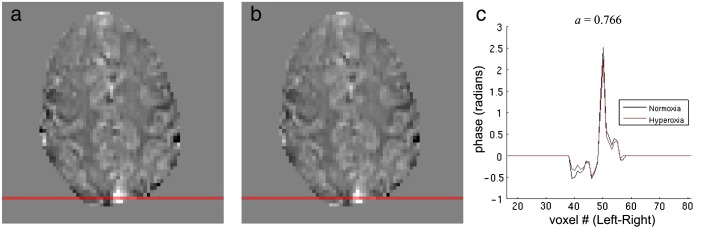
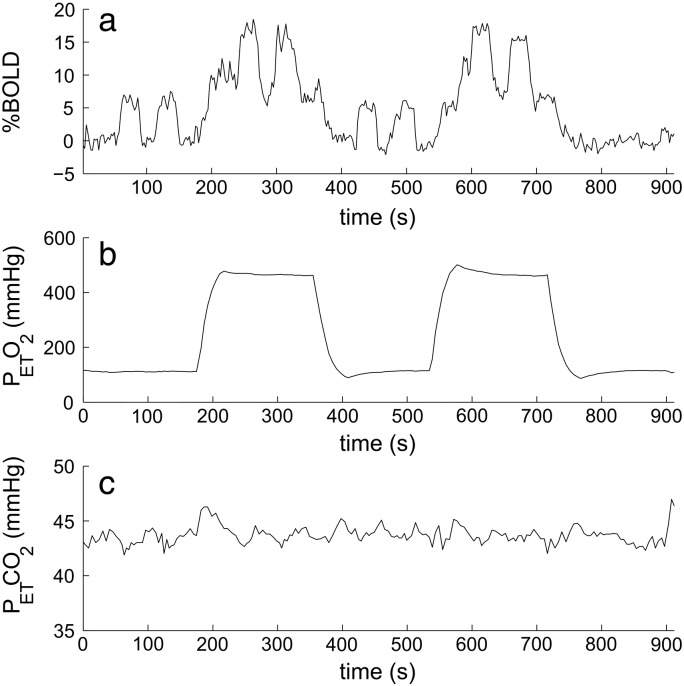
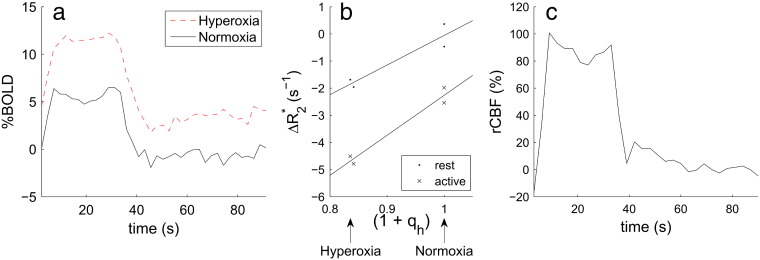
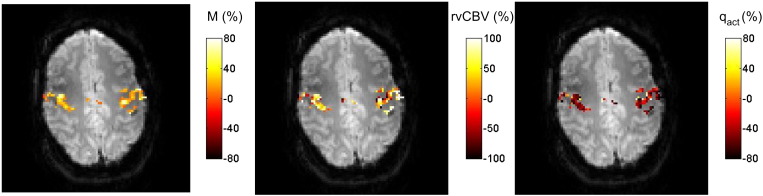
Calibration of the BOLD signal is potentially of great value in providing a closer measure of the underlying changes in brain function related to neuronal activity than the BOLD signal alone, but current approaches rely on an assumed relationship between cerebral blood volume (CBV) and cerebral blood flow (CBF). This is poorly characterised in humans and does not reflect the predominantly venous nature of BOLD contrast, whilst this relationship may vary across brain regions and depend on the structure of the local vascular bed. This work demonstrates a new approach to BOLD calibration which does not require an assumption about the relationship between cerebral blood volume and cerebral blood flow. This method involves repeating the same stimulus both at normoxia and hyperoxia, using hyperoxic BOLD contrast to estimate the relative changes in venous blood oxygenation and venous CBV. To do this the effect of hyperoxia on venous blood oxygenation has to be calculated, which requires an estimate of basal oxygen extraction fraction, and this can be estimated from the phase as an alternative to using a literature estimate. Additional measurement of the relative change in CBF, combined with the blood oxygenation change can be used to calculate the relative change in CMRO(2) due to the stimulus. CMRO(2) changes of 18 ± 8% in response to a motor task were measured without requiring the assumption of a CBV/CBF coupling relationship, and are in agreement with previous approaches.
Copyright © 2012 Elsevier Inc. All rights reserved.
Figures
References
-
- Ayres S.M., Criscitiello A., Grabovsk E. Components of alveolar–arterial O2 difference in normal man. J. Appl. Physiol. 1964;19(1):43–47. - PubMed
-
- Banzett R.B., Garcia R.T., Moosavi S.H. Simple contrivance “clamps” end-tidal Pco(2) and Po-2 despite rapid changes in ventilation. J. Appl. Physiol. 2000;88(5):1597–1600. - PubMed
-
- Blockley N.P., Jiang L., Gardener A.G., Ludman C.N., Francis S.T., Gowland P.A. Field strength dependence of R(1) and R(2)* relaxivities of human whole blood to prohance, vasovist, and deoxyhemoglobin. Magn. Reson. Med. 2008;60(6):1313–1320. - PubMed
-
- Blockley N.P., Driver I.D., Francis S.T., Fisher J.A., Gowland P.A. Susceptibility Artefacts in Experiments Involving Changes in Inspired Oxygen Level. Vol. 17. 2009. p. 1618. (Proc. Intl. Soc. Mag. Reson. Med., Honolulu, Hawaii, USA.).
-
- Blockley N.P., Driver I.D., Fisher J.A., Francis S.T., Gowland P.A. Measuring venous blood volume changes during activation using hyperoxia. Neuroimage. 2012;59(4):3266–3274. - PubMed
Publication types
MeSH terms
Substances
Grants and funding
LinkOut - more resources
Full Text Sources
Other Literature Sources
