. 2012 Dec;13(8):593-604.
doi: 10.1038/gene.2012.41. Epub 2012 Sep 13.

Transcriptional signatures as a disease-specific and predictive inflammatory biomarker for type 1 diabetes

Affiliations

Transcriptional signatures as a disease-specific and predictive inflammatory biomarker for type 1 diabetes

H Levy et al. Genes Immun. 2012 Dec.

Abstract

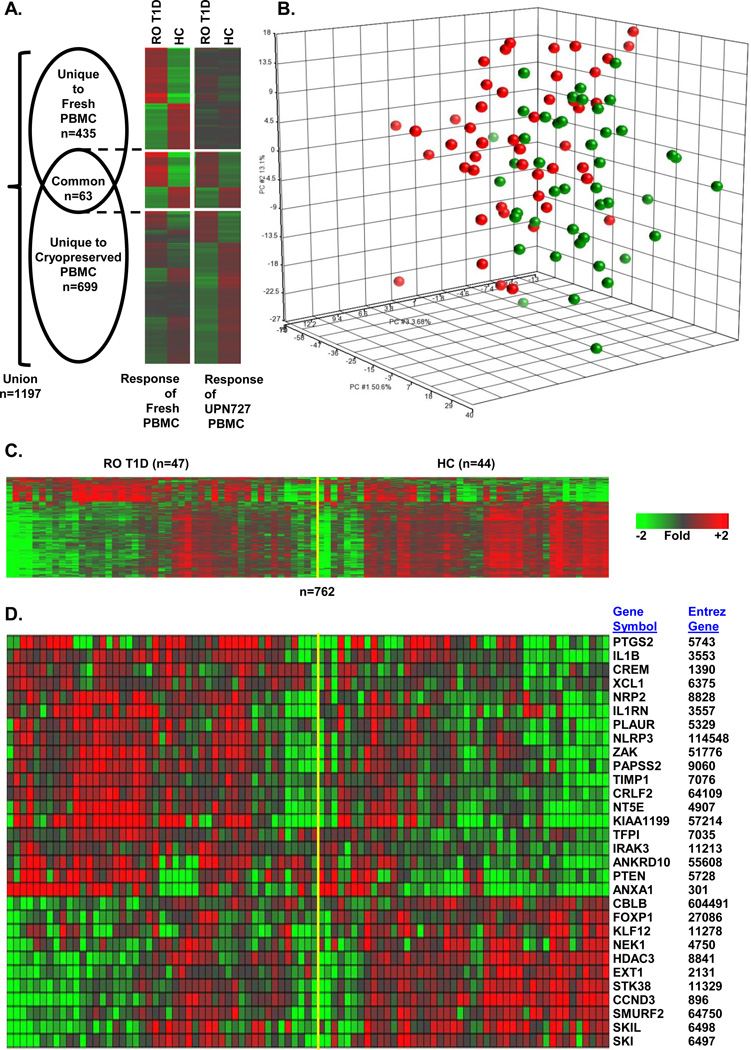
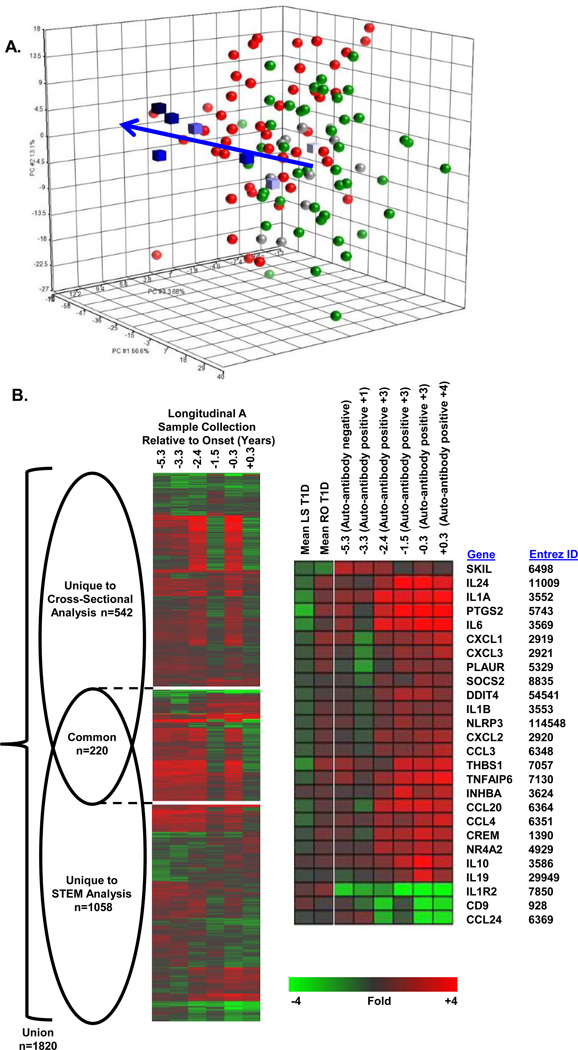
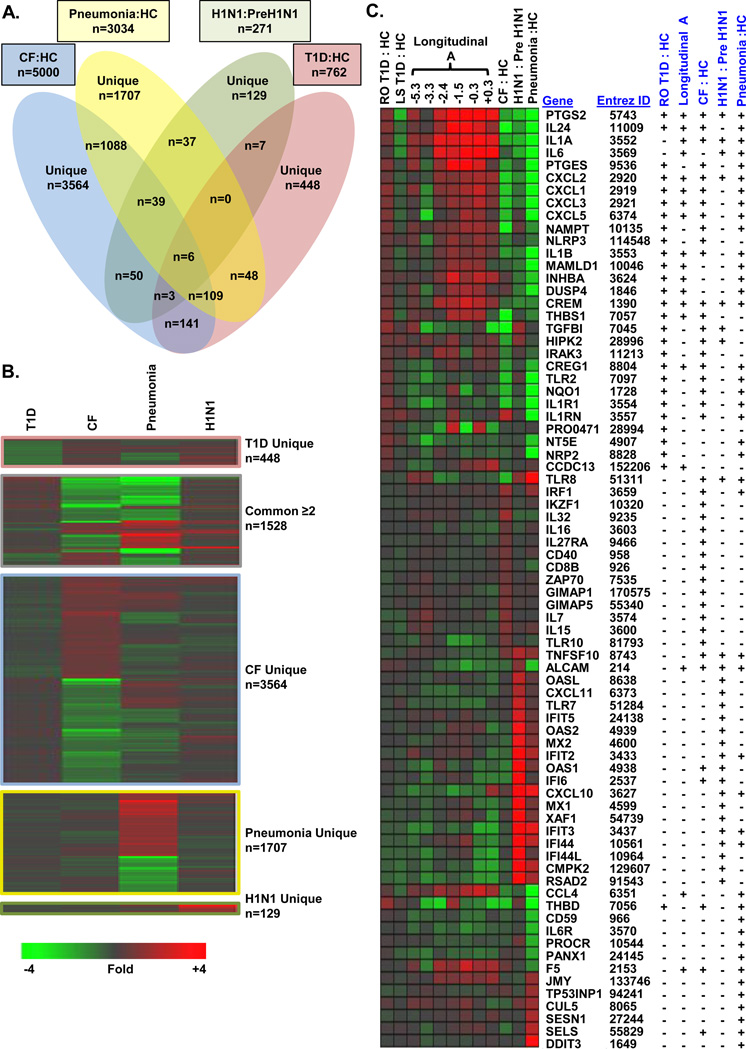
The complex milieu of inflammatory mediators associated with many diseases is often too dilute to directly measure in the periphery, necessitating development of more sensitive measurements suitable for mechanistic studies, earlier diagnosis, guiding therapeutic decisions and monitoring interventions. We previously demonstrated that plasma samples from recent-onset type 1 diabetes (RO T1D) patients induce a proinflammatory transcriptional signature in freshly drawn peripheral blood mononuclear cells (PBMCs) relative to that of unrelated healthy controls (HC). Here, using cryopreserved PBMC, we analyzed larger RO T1D and HC cohorts, examined T1D progression in pre-onset samples, and compared the RO T1D signature to those associated with three disorders characterized by airway infection and inflammation. The RO T1D signature, consisting of interleukin-1 cytokine family members, chemokines involved in immunocyte chemotaxis, immune receptors and signaling molecules, was detected during early pre-diabetes and found to resolve post-onset. The signatures associated with cystic fibrosis patients chronically infected with Pseudomonas aeruginosa, patients with confirmed bacterial pneumonia, and subjects with H1N1 influenza all reflected immunological activation, yet each were distinct from one another and negatively correlated with that of T1D. This study highlights the remarkable capacity of cells to serve as biosensors capable of sensitively and comprehensively differentiating immunological states.


Conflict of interest statement

CONFLICT OF INTEREST

The authors declare no conflict of interest.

Figures

Figure 1
Figure 1
Cross-sectional analysis of RO T1D patients identifies an inflammatory signature relative to unrelated HC subjects. (A) Venn diagram and one-way hierarchical clustering (probe sets only) for each component of the Venn diagram illustrate the relationship between the mean expression of probe sets regulated when fresh cells were previously cultured with plasma from 12 RO T1D and 12 HC subjects (498 probe sets |log2 ratio|>0.5; FDR<0.2) versus culturing UPN727 cells with plasma from 47 RO T1D and 44 HC subjects (n=762; (|log2 ratio|>0.263, 1.2-fold; FDR<0.2; ANOVA p<0.036). (B) PCA using 762 differentially regulated probe sets RO T1D vs HC) in cross-sectional studies. Green spheres, HCs; red spheres, RO T1D subjects. (C) One-way hierarchical clustering (probe sets only) of the RO T1D and HC expression profiles using the 762 regulated probe sets. (D) Relative expression levels of selected, well-annotated genes reflective of innate immune activity in RO T1D patients relative to HC subjects; additional well-annotated genes appear in Figure 3C. Fold of change is expressed relative to the mean of all samples.
Figure 2
Figure 2
Analysis of T1D progression in Longitudinal Subject A. (A) PCA using the 762 probe sets regulated by RO T1D (n=47) vs HC (n=44) plasma identified in the cross-sectional studies (|log2 ratio|>0.263; FDR<0.2). Green spheres, HC; red spheres, RO T1D; grey spheres, LS T1D (>10 years post-onset); blue cubes, Longitudinal Subject A series (lightest to darkest blue indicates sample order, −5.3, −3.3, −2.4, −1.5, −0.3, +0.3 years relative to onset, respectively). Arrow shows progression to RO T1D. (B) Venn diagram and one-way hierarchical clustering (probe sets only) for each component of the Venn diagram illustrate the relationship between the probe sets identified in the STEM analysis of the Longitudinal Subject A series versus the cross-sectional analyses of the RO T1D and HC samples. The signatures share a significantly nonrandom (p<10−51, Χ2 test), commonly regulated intersection of 220 probe sets (Supplemental Table 2). Relative expression levels are shown for selected, well-annotated genes related to inflammatory processes that were significantly identified by the STEM analyses. Additional well-annotated genes are shown in Figure 3C.
Figure 3
Figure 3
Distinctiveness of signatures associated with T1D, CF plus Pa colonization, and H1N1. (A) Venn diagram of the probe sets induced in UPN727 cells following exposure to the plasma from T1D patients (n=47) versus age-matched unrelated HCs (n=44; |log2 ratio|>0.263; FDR<0.20), CF patients harboring Pa (n=20) versus age-matched HCs (n=24; |log2 ratio|>0.263; FDR<0.20), patients with bacterial pneumonia (n=10) versus HCs (n=18; |log2 ratio|>0.5; FDR<0.20), and active versus pre-H1N1 infection (five subjects sampled during and before infection; |log2 ratio|>0.5; paired t-test p<0.05). (B) One-way hierarchical clustering (probe sets only) was conducted for each component of the Venn diagram using mean expression values for each dataset. (C) Well-annotated, differentially expressed genes related to immunological activation, signal transduction, or transcriptional regulation.

References

    1. Jenner RG, Young RA. Insights into host responses against pathogens from transcriptional profiling. Nat Rev Microbiol. 2005;3(4):281–294. - PubMed
    1. Lewis CC, Yang JY, Huang X, Banerjee SK, Blackburn MR, Baluk P, et al. Disease-specific gene expression profiling in multiple models of lung disease. Am J Respir Crit Care Med. 2008;177(4):376–387. - PMC - PubMed
    1. Medzhitov R, Janeway C., Jr Innate immune recognition: mechanisms and pathways. Immunol Rev. 2000;173:89–97. - PubMed
    1. Elson G, Dunn-Siegrist I, Daubeuf B, Pugin J. Contribution of Toll-like receptors to the innate immune response to Gram-negative and Gram-positive bacteria. Blood. 2007;109(4):1574–1583. - PubMed
    1. Underhill DM, Ozinsky A. Toll-like receptors: key mediators of microbe detection. Curr Opin Immunol. 2002;14(1):103–110. - PubMed

Publication types

MeSH terms