. 2013 May;20(5):567-74.
doi: 10.1038/gt.2012.71. Epub 2012 Sep 13.

Viral dose, radioiodide uptake, and delayed efflux in adenovirus-mediated NIS radiovirotherapy correlates with treatment efficacy

Affiliations

Viral dose, radioiodide uptake, and delayed efflux in adenovirus-mediated NIS radiovirotherapy correlates with treatment efficacy

M A Trujillo et al. Gene Ther. 2013 May.

Abstract

We have constructed a prostate tumor-specific conditionally replicating adenovirus (CRAd), named Ad5PB_RSV-NIS, which expresses the human sodium iodine symporter (NIS) gene. LNCaP tumors were established in nude mice and infected with this CRAd to study tumor viral spread, NIS expression, and efficacy. Using quantitative PCR, we found a linear correlation between the viral dose and viral genome copy numbers recovered after tumor infection. Confocal microscopy showed a linear correlation between adenovirus density and NIS expression. Radioiodide uptake vs virus dose-response curves revealed that the dose response curve was not linear and displayed a lower threshold of detection at 10(7) vp (virus particles) and an upper plateau of uptake at 10(11) vp. The outcome of radiovirotherapy was highly dependent upon viral dose. At 10(10) vp, no significant differences were observed between virotherapy alone or radiovirotherapy. However, when radioiodide therapy was combined with virotherapy at a dose of 10(11) vp, significant improvement in survival was observed, indicating a relationship between viral dose-response uptake and the efficacy of radiovirotherapy. The reasons behind the differences in radioiodide therapy efficacy can be ascribed to more efficient viral tumor spread and a decrease in the rate of radioisotope efflux. Our results have important implications regarding the desirable and undesirable characteristics of vectors for clinical translation of virus-mediated NIS transfer therapy.


Conflict of interest statement

AUTHOR DISCLOSURE STATEMENT

No competing financial interests exist

Figures

FIGURE 1
FIGURE 1. Correlation between injected and delivered viral dose after intratumoral injection
Mice were subcutaneously engrafted with LNCaP. When tumor reached approximately 200 mm3 they were infected with Ad5PB_RSV-NIS at 107, 109, or 1011 vp. At day three post-infection, mice were sacrificed and the tumors harvested. Genome copies per milligram of tissue were quantitated by QPCR using a standard curve generated by amplification of known quantities of viral genomes.
FIGURE 2
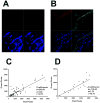
FIGURE 2. Correlation between viral presence and NIS expression
Mice were subcutaneously engrafted with LNCaP. When tumor reached approximately 200 mm3 they were infected with Ad5PB_RSV-NIS at 1011 vp. At day three and ten post-infection mice were sacrificed and the tumors harvested and processed for confocal microscopy as described in Material and Methods.. A) Uninfected control. B) Ten days post-infection. Red quadrant hNIS, green quadrant Adenovirus hexon protein, blue quadrant DAPI, lower right quadrant merged image. The slides were quantified for red and green pixels using Adobe Photoshop CS5 digital imaging software (Adobe Systems Incorporated, San Jose, CA). C) Day three. D) Day ten.
FIGURE 3
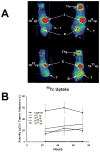
FIGURE 3. Radioiodine Imaging of Xenograft Tumors
A) LNCaP xenografted tumors were infected with Ad5PB_RSV-NIS at the indicated vp. Three days post-infection an injection of 0.5 mCi 99Tc was given IP to all mice. Images were captured using a noninvasive micro SPECT-CT imaging system one hour after radioisotope administration. Thy: Thyroid, S: Stomach, B: Bladder, T: Tumor B) Kinetics of imaging was established by quantifying 99Tc tumor uptake at the indicated times using the PMOD Biomedical Image Quantification and Kinetic Modeling Software (PMOD Technologies, Switzerland).
FIGURE 4
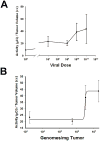
FIGURE 4. Viral dose response measured by in vivo NIS imaging
LNCaP tumors were established in the flanks of nude mice. When the xenografted tumors reached approximately 200 mm3, a single dose of Ad5PB_RSV-NIS at 107, 109, 1010 and 1011 vp was administered intratumorally. NIS mediated 99Tc uptake was visualized using non-invasive micro SPECT-CT imaging system. A) Quantification of 99Tc tumor uptake at the indicated dose was done using the PMOD Biomedical Image Quantification and Kinetic Modeling Software (PMOD Technologies, Switzerland). B) Viral dose was transformed to viral genomes/mg of tumor using the equation fitting the curve depicted in figure 1. The resulting curve was fitted using a logistic model.
FIGURE 5
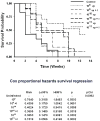
FIGURE 5. Survival analysis
Mice engrafted with LNCaP were divided in groups randomly (average group size n=10±3). Time 0 is defined as the time of viral injection. The average tumor size at time 0 was 125±30 mm3. At time 0, virus was injected intratumorally at the indicated vp. Four days post-injection a single intraperitoneal dose of 3 mCi of 131I was administered (+I), Survival was plotted according to Kaplan-Meier and analyzed using the Cox proportional hazards survival regression.
FIGURE 6
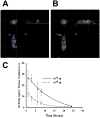
FIGURE 6. Pinhole imaging and radioisotope efflux
LNCaP xenografted tumors were infected with Ad5PB_RSV-NIS at 1010 or 1011 vp. Three days post-infection post-infection an injection of 0.5 mCi 99Tc was given IP to all mice. Pinhole images were captured using a noninvasive micro SPECT-CT imaging system one hour after radioisotope administration. Images were quantified using the PMOD Biomedical Image Quantification and Kinetic Modeling Software (PMOD Technologies, Switzerland). A) Tumors injected with 1010 vp. B) Tumors injected with 1011 vp. C) Radioisotope efflux. Each point was done in triplicate.

Similar articles

Cited by

References

    1. Jemal A, Bray F, Center MM, Ferlay J, Ward E, Forman D. Global cancer statistics.[Erratum appears in CA Cancer J Clin, 2011 Mar–Apr;61(2):134] CA Cancer J Clin. 2011;61(2):69–90. - PubMed
    1. Chiocca EA, Broaddus WC, Gillies GT, Visted T, Lamfers ML. Neurosurgical delivery of chemotherapeutics, targeted toxins, genetic and viral therapies in neuro-oncology. J Neurooncol. 2004;69(1–3):101–17. - PubMed
    1. McCormick F. Cancer gene therapy: fringe or cutting edge? Nat Rev Cancer. 2001;1(2):130–41. - PubMed
    1. Yamamoto M, Curiel DT. Cancer gene therapy. Technol Cancer Res Treat. 2005;4(4):315–30. - PubMed
    1. Carrasco N. Iodide transport in the thyroid gland. Biochim Biophys Acta. 1993;1154(1):65–82. - PubMed

Publication types