

Model analysis of the relationship between intracellular PO2 and energy demand in skeletal muscle
- PMID: 22972834
- PMCID: PMC3588141
- DOI: 10.1152/ajpregu.00106.2012
Model analysis of the relationship between intracellular PO2 and energy demand in skeletal muscle
Abstract
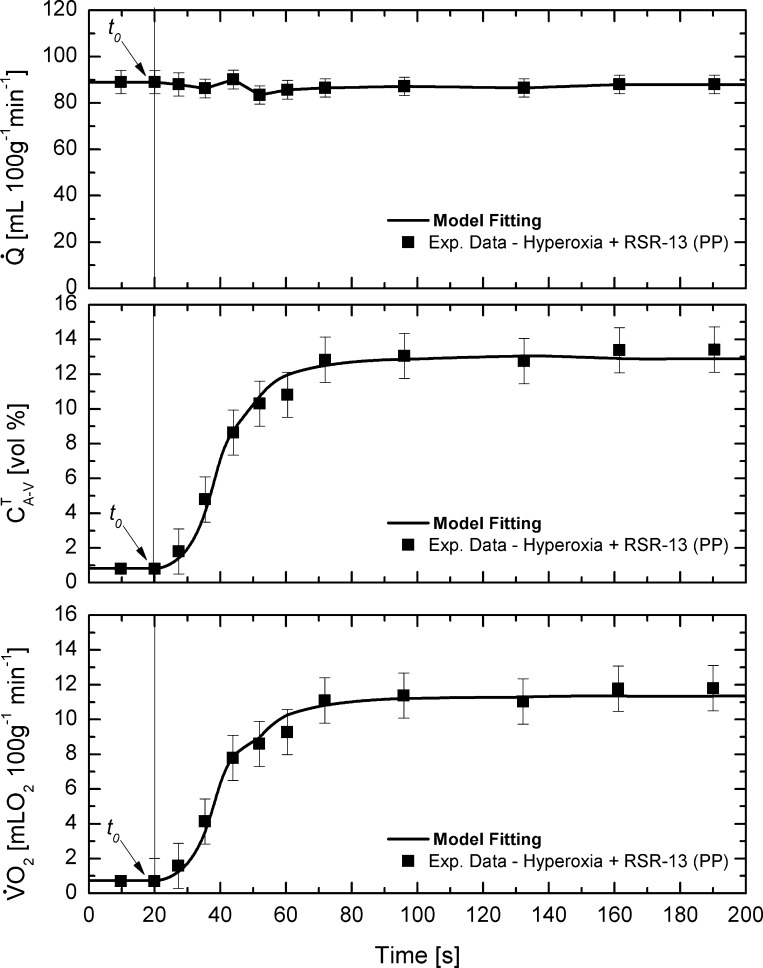
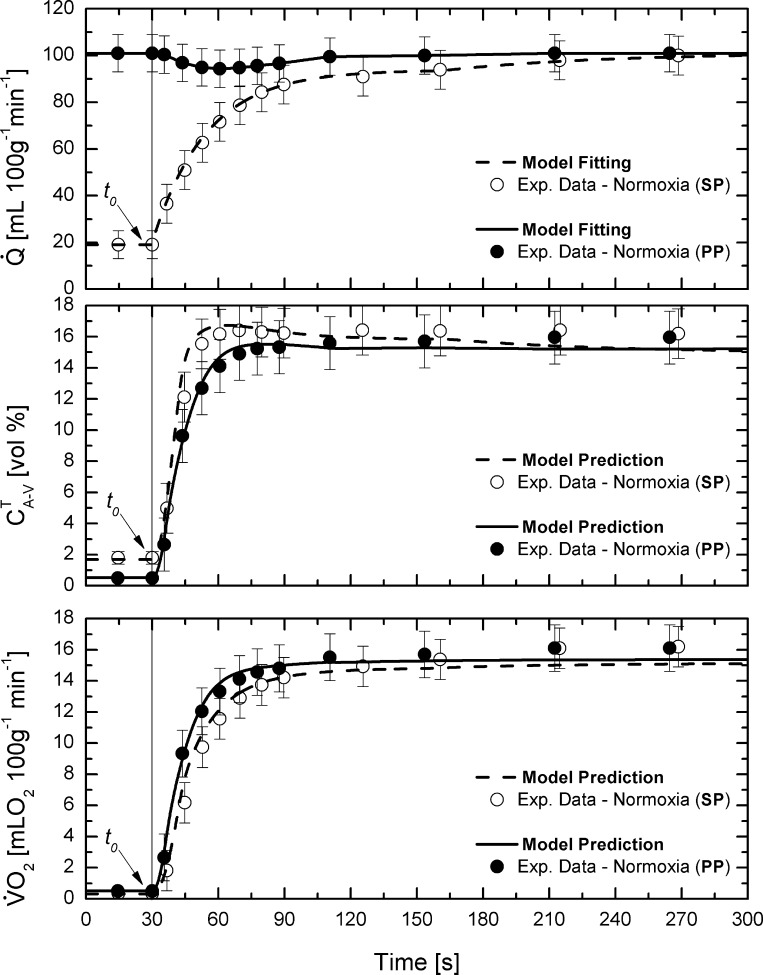
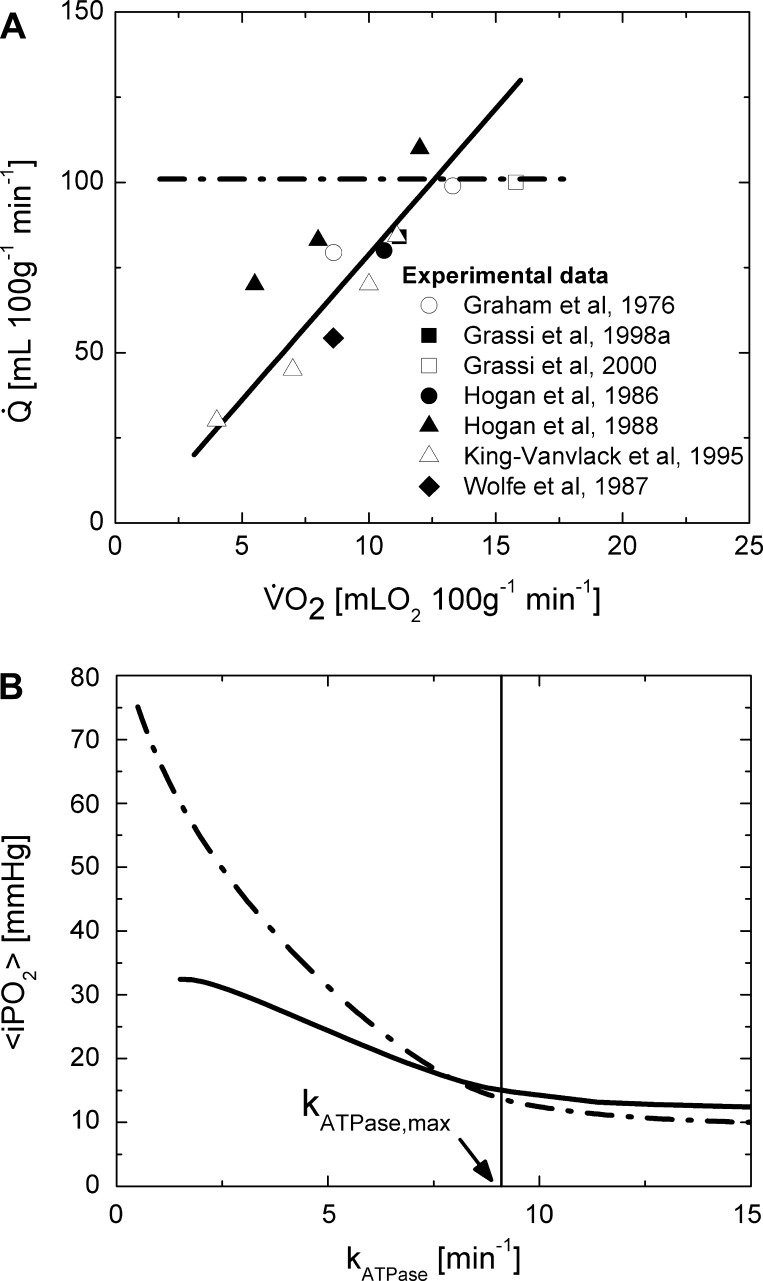
On the basis of experimental studies, the intracellular O(2) (iPo(2))-work rate (WR) relationship in skeletal muscle is not unique. One study found that iPo(2) reached a plateau at 60% of maximal WR, while another found that iPo(2) decreased linearly at higher WR, inferring capillary permeability-surface area (PS) and blood-tissue O(2) gradient, respectively, as alternative dominant factors for determining O(2) diffusion changes during exercise. This relationship is affected by several factors, including O(2) delivery and oxidative and glycolytic capacities of the muscle. In this study, these factors are examined using a mechanistic, mathematical model to analyze experimental data from contracting skeletal muscle and predict the effects of muscle contraction on O(2) transport, glycogenolysis, and iPo(2). The model describes convection, O(2) diffusion, and cellular metabolism, including anaerobic glycogenolysis. Consequently, the model simulates iPo(2) in response to muscle contraction under a variety of experimental conditions. The model was validated by comparison of simulations of O(2) uptake with corresponding experimental responses of electrically stimulated canine muscle under different O(2) content, blood flow, and contraction intensities. The model allows hypothetical variation of PS, glycogenolytic capacity, and blood flow and predictions of the distinctive effects of these factors on the iPo(2)-contraction intensity relationship in canine muscle. Although PS is the main factor regulating O(2) diffusion rate, model simulations indicate that PS and O(2) gradient have essential roles, depending on the specific conditions. Furthermore, the model predicts that different convection and diffusion patterns and metabolic factors may be responsible for different iPo(2)-WR relationships in humans.
Figures


Similar articles
-
Distinguishing the effects of convective and diffusive O₂ delivery on VO₂ on-kinetics in skeletal muscle contracting at moderate intensity.Am J Physiol Regul Integr Comp Physiol. 2013 Sep;305(5):R512-21. doi: 10.1152/ajpregu.00136.2013. Epub 2013 Jun 12. Am J Physiol Regul Integr Comp Physiol. 2013. PMID: 23761640 Free PMC article.
-
Model of oxygen transport and metabolism predicts effect of hyperoxia on canine muscle oxygen uptake dynamics.J Appl Physiol (1985). 2007 Oct;103(4):1366-78. doi: 10.1152/japplphysiol.00489.2007. Epub 2007 Jun 28. J Appl Physiol (1985). 2007. PMID: 17600157
-
Lactate metabolism during exercise: analysis by an integrative systems model.Am J Physiol. 1999 Nov;277(5):R1522-36. doi: 10.1152/ajpregu.1999.277.5.R1522. Am J Physiol. 1999. PMID: 10564227
-
Oxygen uptake kinetics: old and recent lessons from experiments on isolated muscle in situ.Eur J Appl Physiol. 2003 Oct;90(3-4):242-9. doi: 10.1007/s00421-003-0994-0. Epub 2003 Oct 11. Eur J Appl Physiol. 2003. PMID: 14556076 Review.
-
Energy metabolism in muscle approaching maximal rates of oxygen utilization.Med Sci Sports Exerc. 1995 Jan;27(1):54-9. Med Sci Sports Exerc. 1995. PMID: 7898338 Review.
Cited by
-
Dynamics of PO2 and VO2 in resting and contracting rat spinotrapezius muscle.Front Physiol. 2023 Jul 19;14:1172834. doi: 10.3389/fphys.2023.1172834. eCollection 2023. Front Physiol. 2023. PMID: 37538372 Free PMC article.
-
Blood volume versus deoxygenated NIRS signal: computational analysis of the effects muscle O2 delivery and blood volume on the NIRS signals.J Appl Physiol (1985). 2021 Nov 1;131(5):1418-1431. doi: 10.1152/japplphysiol.00105.2021. Epub 2021 Sep 16. J Appl Physiol (1985). 2021. PMID: 34528461 Free PMC article.
-
Relationship between muscle venous blood oxygenation and near-infrared spectroscopy: quantitative analysis of the Hb and Mb contributions.J Appl Physiol (1985). 2023 May 1;134(5):1063-1074. doi: 10.1152/japplphysiol.00406.2022. Epub 2023 Mar 17. J Appl Physiol (1985). 2023. PMID: 36927143 Free PMC article.
-
Increased muscle blood supply and transendothelial nutrient and insulin transport induced by food intake and exercise: effect of obesity and ageing.J Physiol. 2016 Apr 15;594(8):2207-22. doi: 10.1113/jphysiol.2014.284513. Epub 2015 Feb 24. J Physiol. 2016. PMID: 25627798 Free PMC article. Review.
-
Distinguishing the effects of convective and diffusive O₂ delivery on VO₂ on-kinetics in skeletal muscle contracting at moderate intensity.Am J Physiol Regul Integr Comp Physiol. 2013 Sep;305(5):R512-21. doi: 10.1152/ajpregu.00136.2013. Epub 2013 Jun 12. Am J Physiol Regul Integr Comp Physiol. 2013. PMID: 23761640 Free PMC article.
References
-
- Barstow TJ, Jones AM, Nguyen PH, Casaburi R. Influence of muscle fiber type and pedal frequency on oxygen uptake kinetics of heavy exercise. J Appl Physiol 81: 1642–1650, 1996 - PubMed
Publication types
MeSH terms
Substances
Grants and funding
LinkOut - more resources
Full Text Sources