Small-molecule inducers of Aβ-42 peptide production share a common mechanism of action
- PMID: 22972917
- PMCID: PMC3509055
- DOI: 10.1096/fj.12-212985
Small-molecule inducers of Aβ-42 peptide production share a common mechanism of action
Abstract
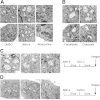
The pathways leading specifically to the toxic Aβ42 peptide production, a key event in Alzheimer's disease (AD), are unknown. While searching for pathways that mediate pathological increases of Aβ42, we identified Aftin-4, a new compound that selectively and potently increases Aβ42 compared to DMSO (N2a cells: 7-fold; primary neurons: 4-fold; brain lysates: 2-fold) with an EC(50) of 30 μM. These results were confirmed by ELISA and IP-WB. Using affinity chromatography and mass spectrometry, we identified 3 proteins (VDAC1, prohibitin, and mitofilin) relevant to AD that interact with Aftin-4, but not with a structurally similar but inactive molecule. Electron microscopy studies demonstrated that Aftin-4 induces a reversible mitochondrial phenotype reminiscent of the one observed in AD brains. Sucrose gradient fractionation showed that Aftin-4 perturbs the subcellular localization of γ-secretase components and could, therefore, modify γ-secretase specificity by locally altering its membrane environment. Remarkably, Aftin-4 shares all these properties with two other "AD accelerator" compounds. In summary, treatment with three Aβ42 raising agents induced similar biochemical alterations that lead to comparable cellular phenotypes in vitro, suggesting a common mechanism of action involving three structural cellular targets.
Figures


Similar articles
-
Brain toxicity and inflammation induced in vivo in mice by the amyloid-β forty-two inducer aftin-4, a roscovitine derivative.J Alzheimers Dis. 2015;44(2):507-24. doi: 10.3233/JAD-140711. J Alzheimers Dis. 2015. PMID: 25298201
-
Induction of Amyloid-β42 Production by Fipronil and Other Pyrazole Insecticides.J Alzheimers Dis. 2018;62(4):1663-1681. doi: 10.3233/JAD-170875. J Alzheimers Dis. 2018. PMID: 29504531 Free PMC article.
-
Aftins increase amyloid-β42, lower amyloid-β38, and do not alter amyloid-β40 extracellular production in vitro: toward a chemical model of Alzheimer's disease?J Alzheimers Dis. 2013;35(1):107-20. doi: 10.3233/JAD-121777. J Alzheimers Dis. 2013. PMID: 23364140 Free PMC article.
-
Proton myo-inositol cotransporter is a novel γ-secretase associated protein that regulates Aβ production without affecting Notch cleavage.FEBS J. 2015 Sep;282(17):3438-51. doi: 10.1111/febs.13353. Epub 2015 Jul 14. FEBS J. 2015. PMID: 26094765 Review.
-
Selective modulation of Abeta42 production in Alzheimer's disease: non-steroidal anti-inflammatory drugs and beyond.Curr Pharm Des. 2006;12(33):4337-55. doi: 10.2174/138161206778793029. Curr Pharm Des. 2006. PMID: 17105431 Review.
Cited by
-
A Collection of Bioactive Nitrogen-Containing Molecules from the Marine Sponge Acanthostrongylophora ingens.Mar Drugs. 2019 Aug 15;17(8):472. doi: 10.3390/md17080472. Mar Drugs. 2019. PMID: 31443260 Free PMC article.
-
A Small Compound Targeting Prohibitin with Potential Interest for Cognitive Deficit Rescue in Aging mice and Tau Pathology Treatment.Sci Rep. 2020 Jan 24;10(1):1143. doi: 10.1038/s41598-020-57560-3. Sci Rep. 2020. PMID: 31980673 Free PMC article.
-
A comparison of cognitive decline in aged mice and mice treated with aftin-4.Sci Rep. 2024 Nov 16;14(1):28320. doi: 10.1038/s41598-024-79792-3. Sci Rep. 2024. PMID: 39550500 Free PMC article.
-
Mitochondrial inner membrane protein, Mic60/mitofilin in mammalian organ protection.J Cell Physiol. 2019 Apr;234(4):3383-3393. doi: 10.1002/jcp.27314. Epub 2018 Sep 14. J Cell Physiol. 2019. PMID: 30259514 Free PMC article. Review.
-
Prohibitin ligands: a growing armamentarium to tackle cancers, osteoporosis, inflammatory, cardiac and neurological diseases.Cell Mol Life Sci. 2020 Sep;77(18):3525-3546. doi: 10.1007/s00018-020-03475-1. Epub 2020 Feb 15. Cell Mol Life Sci. 2020. PMID: 32062751 Free PMC article. Review.
References
-
- Hardy J. A., Higgins G. A. (1992) Alzheimer's disease: the amyloid cascade hypothesis. Science 256, 184–185 - PubMed
-
- Selkoe D. J. (2000) The genetics and molecular pathology of Alzheimer's disease: roles of amyloid and the presenilins. Neurol. Clin. 18, 903–922 - PubMed
-
- Tanzi R. E., McClatchey A. I., Lamperti E. D., Villa-Komaroff L., Gusella J. F., Neve R. L. (1988) Protease inhibitor domain encoded by an amyloid protein precursor mRNA associated with Alzheimer's disease. Nature 331, 528–530 - PubMed
-
- Sisodia S. S., Price D. L. (1995) Role of the β-amyloid protein in Alzheimer's disease. FASEB J. 9, 366–370 - PubMed
Publication types
MeSH terms
Substances
Grants and funding
LinkOut - more resources
Full Text Sources
Other Literature Sources

