. 2012 Oct 15;189(8):4047-59.
doi: 10.4049/jimmunol.1201240. Epub 2012 Sep 12.

Genetic ablation of arginase 1 in macrophages and neutrophils enhances clearance of an arthritogenic alphavirus

Affiliations

Genetic ablation of arginase 1 in macrophages and neutrophils enhances clearance of an arthritogenic alphavirus

Kristina A Stoermer et al. J Immunol. .

Abstract

Chikungunya virus (CHIKV) and Ross River virus (RRV) cause a debilitating, and often chronic, musculoskeletal inflammatory disease in humans. Macrophages constitute the major inflammatory infiltrates in musculoskeletal tissues during these infections. However, the precise macrophage effector functions that affect the pathogenesis of arthritogenic alphaviruses have not been defined. We hypothesized that the severe damage to musculoskeletal tissues observed in RRV- or CHIKV-infected mice would promote a wound-healing response characterized by M2-like macrophages. Indeed, we found that RRV- and CHIKV-induced musculoskeletal inflammatory lesions, and macrophages present in these lesions, have a unique gene-expression pattern characterized by high expression of arginase 1 and Ym1/Chi3l3 in the absence of FIZZ1/Relmα that is consistent with an M2-like activation phenotype. Strikingly, mice specifically deleted for arginase 1 in neutrophils and macrophages had dramatically reduced viral loads and improved pathology in musculoskeletal tissues at late times post-RRV infection. These findings indicate that arthritogenic alphavirus infection drives a unique myeloid cell activation program in inflamed musculoskeletal tissues that inhibits virus clearance and impedes disease resolution in an arginase 1-dependent manner.


Figures

Figure 1
Figure 1. Arginase 1 is induced in inflamed musculoskeletal tissues of RRV-infected mice
Three-four week-old C57BL/6J mice were mock-inoculated (0 dpi) or inoculated with 103 PFU of RRV in the left rear footpad. (A) RT-qPCR analysis of Arg1 mRNA expression in quadriceps muscles of mock-inoculated (n = 5) or RRV-inoculated mice at 3 (n= 5), 5 (n = 4), 7 (n = 7), 10 (n = 7), and 14 dpi (n = 5). Data are normalized to 18S rRNA levels and are expressed as the relative expression (n-fold increase) over Arg1 expression in quadriceps muscles of mock-inoculated mice. Each data point represents the arithmetic mean ± SEM. ***P < 0.001, *P < 0.05 as determined by unpaired t-tests with Welch's correction. (B) RT-qPCR analysis of IL-1β, TNF-α, Il-6, IL-12b, IL-10, IL-4, and IL-13 mRNA expression in quadriceps muscles of mock-inoculated (n = 5) or RRV-inoculated mice at 3 (n= 5), 5 (n = 4), 7 (n = 7), 10 (n = 7), and 14 dpi (n = 5). Data are normalized to 18S rRNA levels and are expressed as the relative expression (n-fold increase) over expression in quadriceps muscles of mock-inoculated mice. Each data point represents the arithmetic mean ± SEM. (C) 5-μm paraffin-embedded sections were generated from the quadriceps muscles of mock or RRV-infected mice at 3, 5, 7, and 10 dpi and H & E stained. Images are representative of 3–4 mice per group. (D) Immunoblot analysis of Arg1 expression in quadriceps muscles and ankle joint tissues of mock-inoculated (0 dpi) or RRV-inoculated mice at 5, 10, 15, and 20 dpi. GAPDH was used as a loading control. n = 2 mice per time point. (E) RT-qPCR analysis of Ym1 and FIZZ mRNA expression in quadriceps muscles of mock-inoculated (n = 5) or RRV-inoculated mice at 7 dpi (n = 7). Data are normalized to 18S rRNA levels and are expressed as the relative expression (n-fold increase) over expression in quadriceps muscles of mock-inoculated mice. Each data point represents the arithmetic mean ± SEM. ***P < 0.001, *P < 0.05 as determined by unpaired t-tests with Welch's correction.
Figure 2
Figure 2. Tissue-infiltrating macrophages express Arginase 1
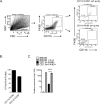
Three-to-four week-old C57BL/6J mice were inoculated with 103 PFU of RRV in the left rear footpad. At 7 dpi, quadriceps muscles were enzymatically digested and CD11bF4/80 and CD11b+F4/80+ cellular infiltrates were FACS-sorted. (A) Shown are representative dot plots of total cells, double-positive and double-negative populations, along with their post-sort purities. (B) Post-sort purities of CD11bF4/80 (n = 4) and CD11b+F4/80+ (n = 4) populations. Each bar represents the arithmetic mean ± SEM. (C) RT-qPCR analysis of Arg1 mRNA expression in unstimulated or IL-4 stimulated (5 ng/ml) bone marrow-derived macrophages (BMDMs) (n = 3), FACS-sorted CD11bF4/80 cells (n =4), and FACS-sorted CD11b+F4/80+ cells (n = 4). Data are normalized to 18S rRNA levels and are expressed as the relative expression (n-fold increase) over Arg1 expression in unstimulated BMDMs. Each data point represents the arithmetic mean ± SEM. ***P = 0.0028 as determined by an unpaired t-test with Welch's correction.
Figure 3
Figure 3. Macrophages isolated from musculoskeletal tissues suppress T cell proliferation ex vivo by a mechanism that is partially Arg1-dependent
Three-to-four week-old C57BL/6J mice (n = 3) or LysMcre;Arg1F/F mice (n = 3) were inoculated with 103 PFU of RRV in the left rear footpad. At 10 dpi, quadriceps muscles were enzymatically digested and CD11b+F4/80+ cellular infiltrates were FACS-sorted and analyzed for immune suppressive activity in a mixed leukocyte reaction. C57BL/6J lymph node cells and irradiated BALB/c splenocytes were incubated in the absence or presence of FACS-sorted CD11b+F4/80+ cells at 1:2, 1:4, 1:8, and 1:16 ratios in the presence of tritiated thymidine. Control wells contained irradiated BALB/c splenocytes only, C57BL/6J lymph node cells only, or C57BL/6J lymph node cells incubated in the presence of C57BL/6J irradiated splenocytes. Thymidine incorporation was quantified after 4 days. Each data point represents the arithmetic mean ± SEM and is representative of two independent experiments. *P < 0.05 as determined by ANOVA followed by Tukey's multiple comparison test.
Figure 4
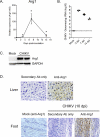
Figure 4. Arginase 1 is induced in inflamed musculoskeletal tissues of CHIKV-infected mice
Three-to-four week old C57BL/6J mice were mock-inoculated (0 dpi) or inoculated with 103 PFU of CHIKV in the left rear footpad. (A) RT-qPCR analysis of Arg1 mRNA expression in the left ankle/foot tissue of mock-inoculated (n = 5) or CHIKV-inoculated mice at 3 (n= 6), 7 (n = 6), and 14 dpi (n = 8). Data are normalized to 18S rRNA levels and are expressed as the relative expression (n-fold increase) over Arg1 expression in left ankle/foot tissue of mock-inoculated mice. Each data point represents the arithmetic mean ± SEM. *P < 0.05 as determined by unpaired t-tests with Welch's correction. (B) CHIKV genomes in the left foot/ankle of mock or CHIKV-infected mice at 3, 7, and 14 dpi were quantified by absolute RT-qPCR as described in the materials and methods. Horizontal bars indicate the mean and the dashed line indicates the limit of detection. (C) Immunoblot analysis of Arg1 expression in ankle/foot tissues of mock-inoculated or CHIKV-inoculated mice at 10 dpi. GAPDH was used as a loading control. Data are representative of two independent experiments. (D) 5-μm sections generated from the liver (upper panel) or ankle/foot (lower panel) at 10 dpi were stained for Arg1 expression by immunohistochemistry. Images are representative of three mice per group.
Figure 5
Figure 5. Expression of Arginase 1 in inflamed tissues of RRV- or CHIKV-infected mice is ablated in LysMcre;Arg1F/F mice
(A) RT-qPCR analysis of Arg1 mRNA expression in quadriceps muscles of mock (n = 3) or RRV-infected WT (n = 7), Arg1F/F (n = 6), LysMCre+/+ (n = 4), and LysMcre;Arg1F/F (n = 5) mice at 7 dpi. Data are normalized to 18S rRNA levels and are expressed as the relative expression (n-fold increase) over Arg1 expression in quadriceps tissue of mock-inoculated mice. Each data point represents the arithmetic mean ± SEM. *P < 0.05 as determined by ANOVA followed by Tukey's multiple comparison test. (B) Immunoblot analysis of Arg1 protein expression in quadriceps muscles of uninfected (mock) or RRV-infected WT and LysMcre;Arg1F/F mice at 10 dpi (n = 3 mice/group). GAPDH was used as a loading control. Arg1 and GAPDH band intensities were quantified and Arg1 expression was normalized to GAPDH and expressed as the fold increase over Arg1 expression in mock-infected mice. ***P = < 0.001 as determined by ANOVA followed by Tukey's multiple comparison test. (C) RT-qPCR analysis of Arg1 mRNA expression in the left ankle/foot tissue of mock-inoculated Arg1-sufficient mice (n = 5), CHIKV-inoculated Arg1F/F mice (n= 6), or CHIKV-inoculated LysMcre;Arg1F/F (n = 6) at 7 dpi. Data are normalized to 18S rRNA levels and are expressed as the relative expression (n-fold increase) over Arg1 expression in left ankle/foot tissue of mock-inoculated mice. Each data point represents the arithmetic mean ± SEM and are cumulative from two independent experiments. ***P < 0.001 as determined by ANOVA followed by Tukey's multiple comparison test.
Figure 6
Figure 6. Gene expression of CD11b+F4/80+ tissue-infiltrating macrophages
(A) Wright-Giemsa staining of FACS-sorted CD11b+F4/80+ cells isolated from quadriceps muscles of RRV-infected WT or LysMcre;Arg1F/F mice at 10 dpi. (B) RT-qPCR analysis of Arg1, Ym1, and FIZZ1 expression in unstimulated or IL-4 stimulated (5 ng/ml) bone marrow-derived macrophages (BMDMs) (n = 3) and FACS-sorted CD11b+F4/80+ cells isolated from quadriceps muscles of RRV-infected WT (n =4) or LysMcre;Arg1F/F mice (n = 4) at 10 dpi. Data are normalized to 18S rRNA levels and are expressed as the relative expression (n-fold increase) over expression in unstimulated BMDMs. Each data point represents the arithmetic mean ± SEM. ***P = 0.007 as determined by unpaired, two-tailed t-tests with Welch's correction.
Figure 7
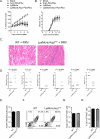
Figure 7. Acute RRV-induced disease is unaltered in LysMcre;Arg1F/F mice
Three-to-four week-old Arg1F/F (n = 24), LysMCre+/+ (n = 25), or LysMcre;Arg1F/F (n = 29) mice were inoculated with 103 PFU of RRV by injection in the left rear footpad and assessed for (A) weight gain and (B) musculoskeletal disease signs including loss of gripping ability and altered gait at 24-hour intervals. Each data point represents the arithmetic mean ± standard deviation (SD). Data are combined from 6–8 independent experiments. No significant differences were detected as determined by repeated measures ANOVA. (C) At 7 dpi, 5-μm paraffin-embedded sections were generated from the gastrocnemius muscle and stained with H&E. Images are representative of 5–7 mice per group. (D) H&E stained sections from 7 dpi were scored in a blinded manner for the degree of inflammation, necrosis, regeneration, mineralization, fibrosis, and edema based on the following scale for percent of tissue affected: 0: absent (0%), 1: minimal (<10%), 2: mild (11–25%), 3: moderate (26–40%), 4: marked (41–60%), and 5: severe (>60%). P values were determined by Mann-Whitney tests. (E) At 7 dpi, infiltrating leukocytes were isolated from enzymatically digested quadriceps muscles of RRV-infected WT (n = 6) or LysMcre;Arg1F/F (n = 8) mice as described in material and methods and the total cell number was determined. Each bar represents the arithmetic mean ± SEM from two independent experiments. No statistically significant differences were detected by an unpaired t-test. (F) Total leukocytes isolated from enzymatically digested quadriceps muscles of RRV-infected WT (n = 6) or LysMcre;Arg1F/F (n = 8) mice at 7 dpi were analyzed by flow cytometry for the expression of CD11b and F4/80. Shown are representative contour plots. (G) Total number and (H) percentages of CD11b+F4/80+ cells isolated from enzymatically digested quadriceps muscles of RRV-infected WT (n = 6) or LysMcre;Arg1F/F (n = 8) mice at 7 dpi. Each bar represents the arithmetic mean ± SEM from two independent experiments. No statistically significant differences were detected by unpaired t-tests.
Figure 8
Figure 8. Specific deletion of Arg1 in macrophages enhances clearance of RRV from musculoskeletal tissues
Three-to-four week-old C57BL/6J WT (7 dpi n = 4; 14 dpi n = 4), Arg1F/F (7 dpi n = 6; 14 dpi n = 8; 21 dpi n = 10), LysMCre+/+ (7 dpi n = 8; 14 dpi n = 9; 21 dpi n = 8), and LysMcre;Arg1F/F (7 dpi n = 8; 14 dpi n = 11; 21 dpi n = 10) mice were inoculated with 103 PFU of RRV by injection in the left rear footpad. At 7, 14, and 21 dpi, mice were sacrificed, perfused by intracardial injection with 1× PBS, and total RNA was isolated from the right quadriceps muscles. RRV genomes were quantified by absolute RT-qPCR as described in the materials and methods. Horizontal bars indicate the mean and dashed lines indicate the limit of detection. *** P ≤ 0.001 as determined by ANOVA followed by Tukey's multiple comparison test.
Figure 9
Figure 9. Inflammatory tissue pathology at late times following RRV infection
Three week-old C57BL/6J WT, Arg1F/F, LysMCre+/+, and LysMcre;Arg1F/F mice were mock-inoculated or inoculated with 103 PFU of RRV by injection in the left rear footpad. At 14 and 21 dpi, 5-μm paraffin-embedded sections were generated from the gastrocnemius muscle and stained with H&E. (A) At 14 dpi, 5-μm paraffin-embedded sections were generated from the gastrocnemius muscle and stained with H&E. Images are representative of 5–7 mice per group. (B) H&E stained sections from 14 and 21 dpi were scored in a blinded manner for the degree of inflammation, necrosis, regeneration, mineralization, fibrosis, and edema based on the following scale for percent of tissue affected: 0: absent (0%), 1: minimal (<10%), 2: mild (11–25%), 3: moderate (26–40%), 4: marked (41–60%), and 5: severe (>60%). P values were determined by Mann-Whitney tests.

Similar articles

Cited by

References

    1. Powers AM, Brault AC, Shirako Y, Strauss EG, Kang W, Strauss JH, Weaver SC. Evolutionary relationships and systematics of the alphaviruses. J Virol. 2001;75:10118–10131. - PMC - PubMed
    1. Harley D, Sleigh A, Ritchie S. Ross River virus transmission, infection, and disease: a cross-disciplinary review. Clin Microbiol Rev. 2001;14:909–932. table of contents. - PMC - PubMed
    1. Williams MC, Woodall JP, Gillett JD. O'nyong-Nyong Fever: An Epidemic Virus Diesease in East Africa. Vii. Virus Isolations from Man and Serological Studies up to July 1961. Trans R Soc Trop Med Hyg. 1965;59:186–197. - PubMed
    1. Weaver SC, Reisen WK. Present and future arboviral threats. Antiviral Res. 2010;85:328–345. - PMC - PubMed
    1. Grandadam M, Caro V, Plumet S, Thiberge JM, Souares Y, Failloux AB, Tolou HJ, Budelot M, Cosserat D, Leparc-Goffart I, Despres P. Chikungunya virus, southeastern France. Emerg Infect Dis. 2011;17:910–913. - PMC - PubMed

Publication types

MeSH terms