. 2012 Dec;108(12):3172-95.
doi: 10.1152/jn.00160.2012. Epub 2012 Sep 12.

Sensitivity of cochlear nucleus neurons to spatio-temporal changes in auditory nerve activity

Affiliations

Sensitivity of cochlear nucleus neurons to spatio-temporal changes in auditory nerve activity

Grace I Wang et al. J Neurophysiol. 2012 Dec.

Abstract

The spatio-temporal pattern of auditory nerve (AN) activity, representing the relative timing of spikes across the tonotopic axis, contains cues to perceptual features of sounds such as pitch, loudness, timbre, and spatial location. These spatio-temporal cues may be extracted by neurons in the cochlear nucleus (CN) that are sensitive to relative timing of inputs from AN fibers innervating different cochlear regions. One possible mechanism for this extraction is "cross-frequency" coincidence detection (CD), in which a central neuron converts the degree of coincidence across the tonotopic axis into a rate code by preferentially firing when its AN inputs discharge in synchrony. We used Huffman stimuli (Carney LH. J Neurophysiol 64: 437-456, 1990), which have a flat power spectrum but differ in their phase spectra, to systematically manipulate relative timing of spikes across tonotopically neighboring AN fibers without changing overall firing rates. We compared responses of CN units to Huffman stimuli with responses of model CD cells operating on spatio-temporal patterns of AN activity derived from measured responses of AN fibers with the principle of cochlear scaling invariance. We used the maximum likelihood method to determine the CD model cell parameters most likely to produce the measured CN unit responses, and thereby could distinguish units behaving like cross-frequency CD cells from those consistent with same-frequency CD (in which all inputs would originate from the same tonotopic location). We find that certain CN unit types, especially those associated with globular bushy cells, have responses consistent with cross-frequency CD cells. A possible functional role of a cross-frequency CD mechanism in these CN units is to increase the dynamic range of binaural neurons that process cues for sound localization.


Figures

Fig. 1.
Fig. 1.
Huffman sequences and auditory nerve (AN) model response patterns. A: waveforms and magnitude and phase spectra of 2 Huffman sequences with transition frequency (FT) 1,000 Hz and r values 0.85 (“broad phase transition,” red) and 0.95 (“sharp phase transition,” black). The phase spectrum shows a 2π phase transition centered at FT whose bandwidth is controlled by the parameter r. B: spatio-temporal response pattern of a tonotopic array of model AN fibers (Zilany and Bruce 2006) to the 2 Huffman stimuli in A at 36 dB SPL. Local maxima of the response pattern are shown by circles, with the relative area of each circle indicating the height of the corresponding response peak. The y-axis represents characteristic frequency (CF) and is shown both in kHz (right) and in normalized frequency units CF/FT (left). The x-axis represents time in cycles of FT. The black line is the delay of the cochlear traveling wave estimated from the first peak in model responses to 0.1-ms clicks at 50 dB peak SPL. C: responses of a single model fiber with CF 1 kHz to Huffman stimuli with varying FT (right y-axis). The range of FT was chosen to obtain the same range of normalized frequencies CF/FT as in B (left y-axis).
Fig. 2.
Fig. 2.
Response patterns of real and model AN fibers with CF 972 Hz to Huffman stimuli with varying FT on the y-axis and time in cycles of FT on the x-axis: responses to stimulus with broad phase transition in red and sharp phase transition in black. A: model fiber response poststimulus time histograms (PSTHs) at 26 dB re. CF tone threshold (41 dB SPL). B: real fiber response PSTHs at 26 dB re. CF threshold (61 dB SPL). C: peak locations and fitted lines for AN fiber response in B. D–F: same as A–C at 41 dB re. CF threshold (56 dB SPL for model fiber, 76 dB SPL for real fiber).
Fig. 3.
Fig. 3.
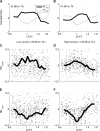
Normalized rate differences between responses to broad- and sharp-transition stimuli (Broad − Sharp)/(Broad + Sharp) for example fiber (A and B) and sample of 44 AN fibers (C–F). A: early (RDEarly) and late (RDLate) rate differences vs. CF/FT for example AN fiber from Fig. 2 at 26 dB re. CF threshold (61 dB SPL). B: same as in A, but at 41 dB re. CF threshold (76 dB SPL). C: RDEarly against CF/FT for the sample of AN fibers at low stimulus levels (<29 dB re. CF threshold). Each dot shows data from 1 individual fiber, while lines indicate moving averages across the sample. x-Axes are truncated to emphasize trends in the moving averages. D: same as in C, but at higher levels (≥29 dB re. CF threshold). E: RDLate for AN sample at low levels (<29 dB re. CF threshold). F: same as in E, but at higher levels (≥29 dB re. CF threshold).
Fig. 4.
Fig. 4.
Scatterplots of absolute slopes of fitted lines to sets of response peaks for sharp-transition stimulus against slopes for broad-transition stimulus across sample of AN fibers. Slopes for peaks 1, 2, 3, and 4+ (4 and higher) are shown in separate panels. Slopes were measured from AN fibers responding to varying FT stimuli as in Fig. 2 and are expressed as frequency ratios (CF/FT) divided by normalized time in cycles of FT. Peak numbers are evaluated by reference to the closest model peak.
Fig. 5.
Fig. 5.
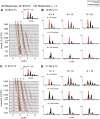
Responses of AN fiber and model coincidence detector (CD) cells to Huffman stimuli with broad (red) and sharp (black) phase transitions. A, inset shows responses (spikes/s) of the 972-Hz AN fiber when FT = CF (same fiber as in Fig. 2). Main panel shows interpolated AN response patterns in fine steps of virtual CF on the y-axis (arrow points to the pattern shown in inset). Stimulus level is 26 dB re. CF tone threshold (61 dB SPL). B: responses of model CD cells with N = 4 (left), 10 (center), and 16 (right) inputs taken from the AN response pattern in A. The output cell produces a spike if at least L = 2 of its inputs fire within a 0.1-ms coincidence window. Responses are shown for model cells with different CF ranges of inputs: w = 0 (same-frequency CD, top), 0.4 (midrange CD, middle), and 0.8 (wide-range CD, bottom) octaves. y-Axes are in spikes/s. C and D: same as in A and B but for 41 dB re. CF tone threshold (76 dB SPL).
Fig. 6.
Fig. 6.
Normalized rate differences to Huffman stimuli with broad vs. sharp transition widths for AN fiber and CD cells from Fig. 5, as a function of CF range of inputs w to the CD cell. A: RDEarly (CD solid line, AN filled circle on y-axis) and RDLate (CD dashed line, AN × on y-axis) at 26 dB re. CF tone threshold. B: same as in A but for 41 dB re. CF tone threshold. The CD cells were driven by virtual spatio-temporal patterns of the example fiber in Fig. 2.
Fig. 7.
Fig. 7.
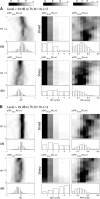
Histograms of the distributions of 6 metrics used to characterize responses of AN fibers and CD cells to Huffman stimuli for low (<29 dB re. CF tone threshold, A) and high (≥29 dB re. CF tone threshold, B) stimulus levels. Histograms are based on 125 recordings from 44 AN fibers, each used as input to CD model cells. Images show distributions for CD cells (N = 10, L = 2) as a function of the CF range of inputs w; gray scale (see maps at top of figure) represents % of recordings for each w. Bar plots below each image show the corresponding distributions for AN fibers when FT = CF. Left: distributions of RDEarly and RDLate are shown at top and bottom, respectively. Temporal metrics normalized response duration (ND) and mean peak width (PW) in cycles of FT are shown at center and right, respectively. For ND and PW, broad transition responses are shown at top and sharp transition responses at bottom.
Fig. 8.
Fig. 8.
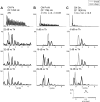
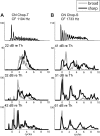
Example responses of cochlear nucleus (CN) units to Huffman stimuli. Top: responses to 30-ms tone bursts at CF at 80 (A), 70 (B), and 60 (C) dB SPL. Bottom 3 rows show responses to Huffman stimuli with FT = CF at 3 different stimulus levels expressed in dB re. CF tone threshold. Broad transition response is shown in gray, sharp transition response in black. All y-axes are in spikes/s. A: primary-like (Pri) unit, CF tone threshold = 24 dB SPL. B: primary-like-with-notch (Pri-N) unit, CF tone threshold = 32 dB SPL. C: onset (On) unit, CF tone threshold = 49 dB SPL. Inset, bottom right: likelihood that the responses observed in the On unit result from a CD cell (N = 10, L = 2) as a function of CF range of inputs w.
Fig. 9.
Fig. 9.
Distributions of RDEarly (left) and RDLate (right) measured from responses of 40 Pri (A) and 10 Pri-N (B) units at low (<29 dB re. CF tone threshold, top) and high (≥29 dB re. CF tone threshold, bottom) stimulus levels.
Fig. 10.
Fig. 10.
Example responses of low-CF CN units, using the same format as in Fig. 8. Top: responses to 30-ms tone bursts at CF at 80 (A), 80 (B), and 65 (C) dB SPL. A: high-synchrony (HiS) unit, CF tone threshold = 24 dB SPL. B: phase locking (PhL) unit, CF tone threshold = 40 dB SPL. C: PhL unit, CF tone threshold = 30 dB SPL.
Fig. 11.
Fig. 11.
Example responses of CN chopper units, as in Fig. 8. Top: responses to 30-ms tone bursts at CF at 55 (A) and 60 (B) dB SPL. Bottom 3 rows show responses with FT = CF at 3 different stimulus levels expressed in dB re. CF tone threshold. A: transient chopper (Chop-T) unit, CF tone threshold = 14 dB SPL. B: sustained chopper (Chop-S) unit, CF tone threshold = 20 dB SPL.
Fig. 12.
Fig. 12.
Distributions of total rate differences (RDTotal) measured from 10 transient (Ch-T; A) and 10 sustained (Ch-S; B) chopper units at low (<29 dB re. CF tone threshold, top) and high (≥29 dB re. CF tone threshold, bottom) stimulus levels.
Fig. 13.
Fig. 13.
Images show distributions of RDTotal for model CD cells (N = 10, L = 2) at low (<29 dB re. CF tone threshold, A) and high (≥29 dB re. CF tone threshold, B) levels. Distributions are based on 125 recordings from 44 AN fibers and are shown as a function of CF range of inputs w on the y-axis; gray scale (see map at right) represents % of recordings for each w. Bar plots below each image show the corresponding distributions for AN fibers when FT = CF.

Similar articles

Cited by

References

    1. Babalian AL, Jacomme AV, Doucet JR, Ryugo DK, Rouiller EM. Commissural glycinergic inhibition of bushy and stellate cells in the anteroventral cochlear nucleus. Neuroreport 13: 555–558, 2002 - PubMed
    1. Blackburn CC, Sachs MB. Classification of unit types in the anteroventral cochlear nucleus: post-stimulus time histograms and regularity analysis. J Neurophysiol 62: 1303–1329, 1989 - PubMed
    1. Bourk TR. Electrical Responses of Neural Units in the Anteroventral Cochlear Nucleus of the Cat (PhD thesis). Cambridge, MA: MIT, 1976
    1. Brand A, Behrend O, Marquardt T, McAlpine D, Grothe B. Precise inhibition is essential for microsecond interaural time difference coding. Nature 417: 543–547, 2002 - PubMed
    1. Bruce IC, Sachs MB, Young ED. An auditory-periphery model of the effects of acoustic trauma on auditory nerve responses. J Acoust Soc Am 113: 369–388, 2003 - PubMed

LinkOut - more resources