. 2012 Sep 12;32(37):12744-55.
doi: 10.1523/JNEUROSCI.1291-12.2012.

Group I mGluR-mediated inhibition of Kir channels contributes to retinal Müller cell gliosis in a rat chronic ocular hypertension model

Affiliations

Group I mGluR-mediated inhibition of Kir channels contributes to retinal Müller cell gliosis in a rat chronic ocular hypertension model

Min Ji et al. J Neurosci. .

Abstract

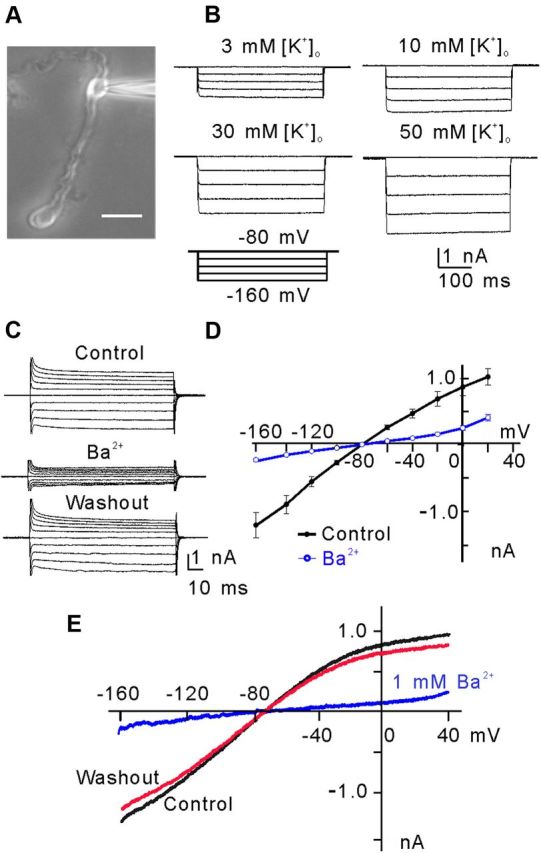
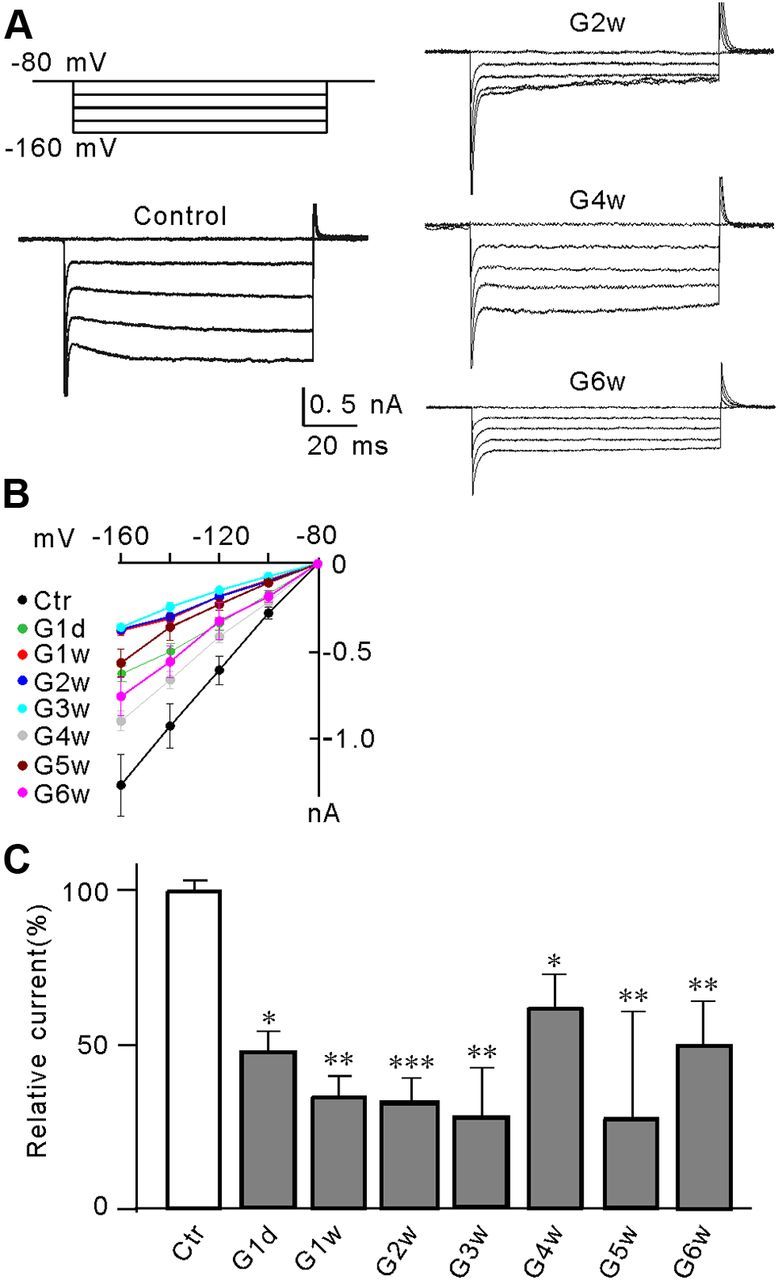
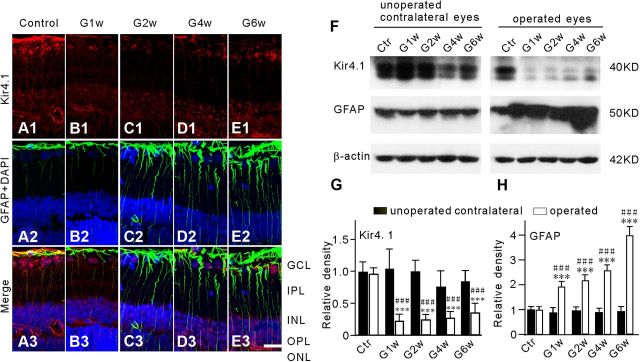
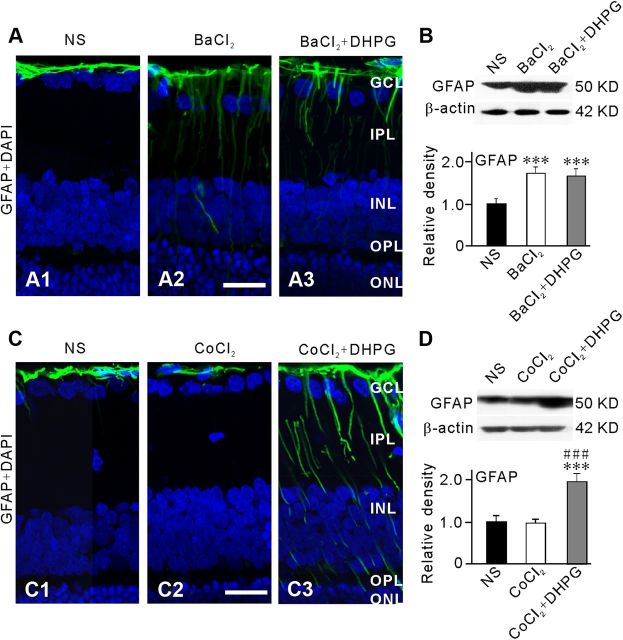
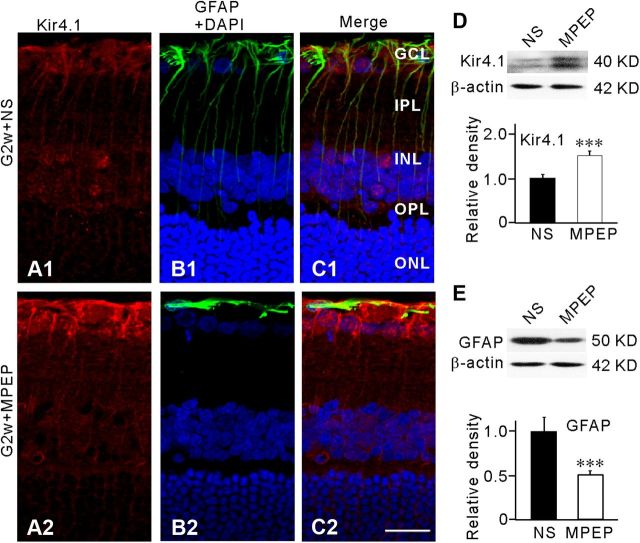
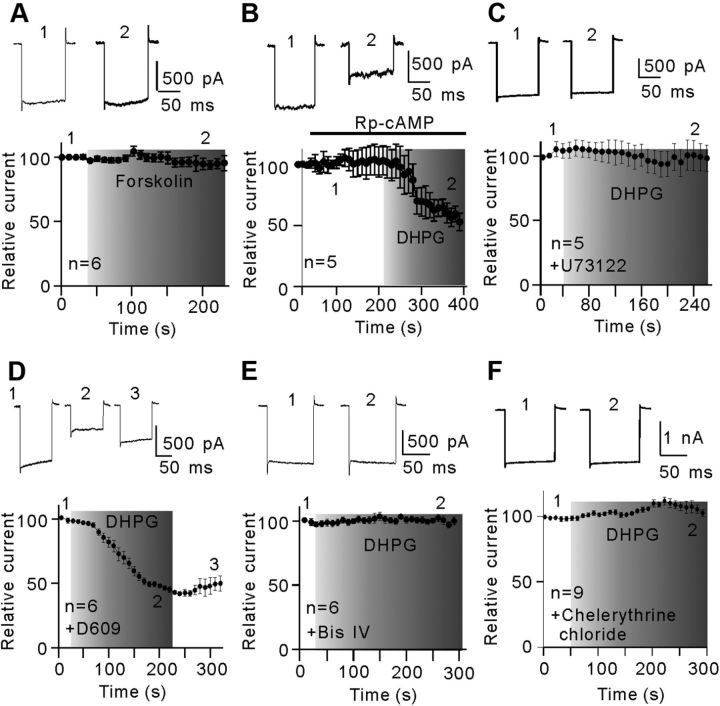
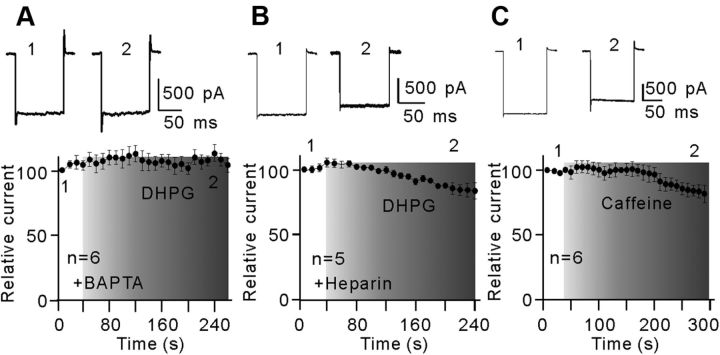
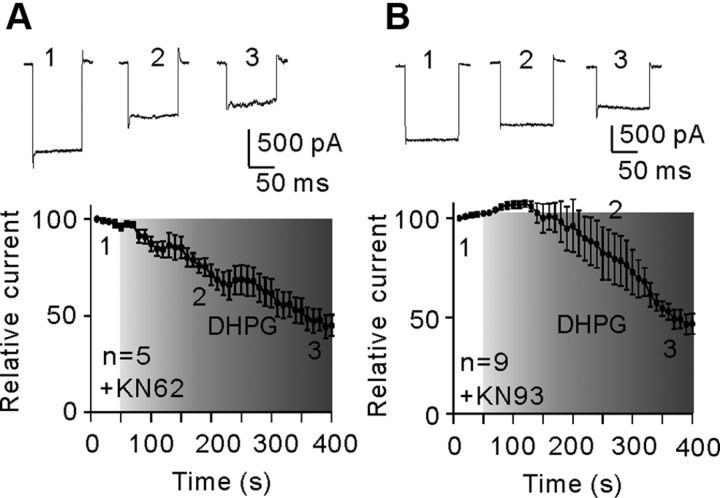
Müller cell gliosis, which is characterized by upregulated expression of glial fibrillary acidic protein (GFAP), is a universal response in many retinal pathological conditions. Whether down-regulation of inward rectifying K+ (Kir) channels, which commonly accompanies the enhanced GFAP expression, could contribute to Müller cell gliosis is poorly understood. We investigated changes of Kir currents, GFAP and Kir4.1 protein expression in Müller cells in a rat chronic ocular hypertension (COH) model, and explored the mechanisms underlying Müller cell gliosis. We show that Kir currents and Kir4.1 protein expression in Müller cells were reduced significantly, while GFAP expression was increased in COH rats, and these changes were eliminated by MPEP, a group I metabotropic glutamate receptors (mGluR I) subtype mGluR5 antagonist. In normal isolated Müller cells, the mGluR I agonist (S)-3,5-dihydroxyphenylglycine (DHPG) suppressed the Kir currents and the suppression was blocked by MPEP. The DHPG effect was mediated by the intracellular Ca2+ -dependent PLC/IP3-ryanodine/PKC signaling pathway, but the cAMP-PKA pathway was not involved. Moreover, intravitreal injection of DHPG in normal rats induced changes in Müller cells, similar to those observed in COH rats. The DHPG-induced increase of GFAP expression in Müller cells was obstructed by Ba2+, suggesting the involvement of Kir channels. We conclude that overactivation of mGluR5 by excessive extracellular glutamate in COH rats could contribute to Müller cell gliosis by suppressing Kir channels.


Figures

Figure 1.
Figure 1.
Inwardly rectifying K+-selective current (Kir) in rat retinal Müller cells. A, Micrograph showing a typical isolated rat Müller cell. Scale bar, 10 μm. B, [K+]o dependence of hyperpolarization-activated Kir currents of Müller cells. The currents were evoked by a series of hyperpolarized voltage pulses from a holding potential of −80 mV in increments of −20 mV. Note that the current amplitudes were increased with an increase in [K+]o. C, Ba2+ (1 mm) blocked the membrane currents of a Müller cell, voltage clamped at −80 mV and stepped to −160 mV in −10 mV increments and then to +20 mV in 10 mV increments. D, Membrane currents plotted against the step potentials. Note the K+-selective weakly rectifying Kir4.1-like I–V relationship (n = 10). The Kir currents were reduced significantly by Ba2+ (1 mm). E, Currents elicited by a 1 s voltage ramp from −160 mV to +40 mV before (control), after the application of Ba2+ (1 mm) and washout of Ba2+.
Figure 2.
Figure 2.
Suppression of Kir currents in Müller cells in a rat COH model. A, Voltage-clamp analysis of the Kir current changes at negative membrane potentials. Cells were clamped at −80 mV and stepped to −160 mV in −20 mV increments (top left). Whole-cell membrane currents were recorded in Müller cells isolated from sham-operated control (Ctr) and COH rats on the second (G2w), fourth (G4w), and sixth week (G6w) after the operation. B, The I–V relationships, showing voltage-dependent suppression of Kir current amplitudes in Müller cells obtained from Ctr and COH rats at the first day after surgery (G1d), and the first to sixth week (G1w–G6w) after the operation C, Summarized data showing that the average Kir current peak amplitudes decreased when the IOP was elevated. All data are normalized to control. Error bars represent SEM. n = 8∼15, *p < 0.05, **p < 0.01, and ***p < 0.001 versus control (Ctr).
Figure 3.
Figure 3.
Changes in Kir4.1 and GFAP expression in Müller cells of COH rats. A1–E1, Immunofluorescence labeling showing the changes in Kir4.1 protein expression in rat retinal vertical slices taken from sham-operated retina (Control), and those obtained at the first (G1w), second (G2w), fourth (G4w), and sixth week (G6w) after the operation. Note that Kir4.1 expression in the endfeet of Müller cells was reduced in the COH retinal sections (B1, C1, D1, E1). A2–E2, Immunohistochemical staining showing DAPI and GFAP protein expression in the same slices as shown in A1, B1, C1, D1, and E1, respectively. C3–E3, Merged images of A1–E1 and A2–E2. Scale bar, (for all the images) 20 μm. IPL, Inner plexiform layer; INL, inner nuclear layer; ONL, outer nuclear layer. F, Representative immunoblots showing the changes in Kir4.1 (top) and GFAP (middle) protein expression in sham-operated (Ctr) and COH retinal extracts obtained from both operated eyes and their unoperated contralateral eyes in the same rats at different time points (G1w, G2w, G4w, and G6w) after the operation. G, H, Bar charts summarizing the average densitometric quantification of immunoreactive bands of Kir4.1 (G) and GFAP (H) protein expression at different time points after the operation. All data are normalized to control (Ctr). n = 6 all groups. ***p < 0.001 versus the unoperated contralateral eyes in the same rats, and ###p < 0.001 versus Ctr.
Figure 4.
Figure 4.
Activation of mGluR I suppresses Kir currents in Müller cells. A, DHPG (10 μm), a selective mGluR I receptor agonist, inhibited remarkably and reversibly Kir currents. The currents were evoked by a series of pulses from a holding potential of −80 mV to −160 mV in −20 mV increments. The I–V relationships show voltage-dependent reduction in Kir current amplitudes. n = 10. B, Plot of Kir inward currents evoked by a voltage step from a holding potential of −80 mV to −160 mV as a function of time, showing that DHPG (10 μm) significantly suppressed the Kir current amplitudes. n = 6. The representative current traces (top) are taken from the time points as indicated. C, Internal dialysis of GDP-β-S (3 mm) prevented the DHPG-induced suppression of Kir currents. The representative current traces (top) are used to generate the plot. n = 5. D, Plot of Kir inward currents as a function of time, showing that preperfusion of MPMQ (10 μm) failed to block DHPG-induced reduction in Kir current amplitudes. n = 6. The representative current traces (top) are taken from the time points as indicated. E, Plot of Kir inward currents as a function of time, showing that preperfusion of MPEP (10 μm) blocked DHPG-induced reduction in Kir current amplitudes. n = 5. The representative current traces (top) are taken from the time points as indicated. All the current amplitudes are normalized to the amplitude of the first evoked event.
Figure 5.
Figure 5.
DHPG decreases Kir4.1 protein expression and induces GFAP expression in Müller cells. DHPG (10 μm) or vehicle (0.9% saline, NS) were injected into the vitreous space in a volume of 2 μl. The retinas were sectioned 2 weeks after the injection. A1, A2, Immunofluorescence labeling showing the Kir4.1 protein expression in retinal vertical slices taken from the NS- (A1) or the DHPG- (A2) injected rat. B1, B2, Immunofluorescence labeling showing the GFAP protein expression and DAPI in the same slices as shown in A1 and A2. C1, C2, Merged images of A1 and B1, A2 and B2, respectively. Scale bar, 20 μm. D, Representative Western blot analysis showing the Kir4.1 protein expression in the NS- and DHPG-injected eyes (top). Bar chart summarizing the Kir4.1 protein expression in the NS- and DHPG-injected eyes (below). n = 6, ***p < 0.001 versus NS. E, Representative Western blot analysis showing the GFAP protein expression in the NS- and DHPG-injected eyes (top). Bar chart summarizing the GFAP protein expression in the NS- and DHPG-injected eyes (below). n = 6, ***p < 0.001 versus NS. All data were normalized to those obtained in the NS eyes.
Figure 6.
Figure 6.
Inhibition of Kir channels blocks DHPG-induced increase in GFAP expression in Müller cells. BaCl2 (200 μm), CoCl2 (50 μm), DHPG (10 μm), or vehicle (0.9% saline, NS) were injected into the vitreous space in a volume of 2 μl. BaCl2 or CoCl2 was injected 1 d before DHPG injection and the retinas were collected 5 d after the DHPG injection. A1A3, Immunofluorescence labeling showing the GFAP protein expression and DAPI in retinal vertical slices taken from the NS- (A1), the BaCl2- (A2), and the BaCl2+DHPG- (A3) injected rats. B, Representative Western blot analysis showing the GFAP protein expression in NS-, BaCl2- and BaCl2+DHPG-injected eyes (top). Bar chart summarizing the GFAP protein expression in NS-, BaCl2-, and BaCl2+DHPG-injected eyes (below). n = 6. ***p < 0.001 versus NS. C1–C3, Immunofluorescence labeling showing the GFAP protein expression and DAPI in retinal vertical slices taken from NS- (C1), CoCl2- (C2), and CoCl2+DHPG- (C3) injected rats. D, Representative Western blot analysis showing the GFAP protein expression in NS-, CoCl2-, and CoCl2+DHPG-injected eyes (top). Bar chart summarizing the GFAP protein expression in NS-, CoCl2-, and CoCl2+DHPG-injected eyes (below). n = 6 for NS and 4 for CoCl2 and CoCl2+DHPG groups, respectively. ***p < 0.001 versus NS and ###p < 0.001 versus CoCl2 alone. All data were normalized to those obtained in the NS eyes. Scale bar, (for all the images) 20 μm.
Figure 7.
Figure 7.
Selective mGluR5 antagonist MPEP modulates Kir4.1 protein expression and inhibits GFAP expression in COH model. MPEP (1 μm) or vehicle (0.9% saline, NS) were injected into the vitreous space in a volume of 2 μl 3 d before the operation. A1, A2, Immunofluorescence labeling showing the Kir4.1 protein expression in retinal vertical slices taken from NS- (A1) or MPEP- (A2) injected rat at second week (G2w) after the operation. B1, B2, Immunofluorescence labeling showing the GFAP protein expression and DAPI in the same slices as shown in A1 and A2. C1, C2, Merged images of A1 and B1, A2 and B2, respectively. Scale bar, 20 μm. D, Representative Western blot analysis showing the Kir4.1 protein expression in NS- and MPEP-injected eyes (top). Bar chart summarizing the Kir4.1 protein expression in NS- and MPEP-injected eyes (below). n = 6, ***p < 0.001 versus NS. E, Representative Western blot analysis showing the GFAP protein expression in NS- and MPEP-injected eyes (top). Bar chart summarizing the GFAP protein expression in NS- and MPEP-injected eyes (below). n = 6, ***p < 0.001 versus NS. All data were normalized to those obtained in the NS eyes.
Figure 8.
Figure 8.
PLC-PKC signaling pathway mediates the DHPG-induced inhibition of Kir currents. A, Plot of Kir inward currents as a function of time, showing that forskolin (5 μm) hardly changed the Kir currents. n = 6. The representative current traces (top) are taken from the time points as indicated. B, Plot of Kir inward currents evoked by a hyperpolarized voltage pulse from a holding potential of −80 mV to −160 mV as a function of time. Rp-cAMP (20 μm) failed to block the DHPG-induced reduction in Kir current amplitudes. The representative current traces (top) are used to generate the plot. n = 5. C, D, Plot of Kir inward currents as a function of time, showing that internal preinfusion of U73122 (5 μm) (C, n = 5), but not D609 (60 μm) (D, n = 6), blocked the inhibition effect of DHPG on Kir currents. The representative current traces (top) are taken from the time points as indicated. E, Kir current as a function of time, showing that intracellular pre-dialysis of Bis IV (5 μm) completely eliminated the DHPG effect on Kir currents (n = 6). The representative current traces are shown at the top. F, Kir current as a function of time, showing that extracellular application of chelerythrine chloride (5 μm) completely eliminated the DHPG effect on Kir currents (n = 9). All the current amplitudes are normalized to the amplitude of the first evoked event.
Figure 9.
Figure 9.
Ca2+ release from intracellular stores is involved in the DHPG effect on Kir currents. A, Plot of Kir inward currents as a function of time, showing that internal preperfusion of BAPTA (10 mm) to chelate intracellular Ca2+ eliminated fully the DHPG effect on Kir currents (n = 6). The representative current traces recorded at different time points are shown at the top as indicated. B, Plot of Kir inward currents as a function of time, showing that intracellular preinfusion of heparin (5 mg/ml) partially rescued the DHPG-induced inhibition in Kir currents (n = 5). The representative current traces (top) are taken from the time points as indicated. C, Plot of Kir inward currents as a function of time, showing that extracellular perfusion of caffeine (1 mm) induced a minor reduction in Kir currents with a long time delay (n = 6). The representative current traces are shown at the top. All the current amplitudes are normalized to the amplitude of the first evoked event.
Figure 10.
Figure 10.
No involvement of CaMKII in DHPG-induced inhibition of Kir currents. A, B, Plots of Kir currents as a function of time, showing that extracellular application of CaMKII inhibitors KN-62 (5 μm) (A, n = 5) or KN-93 (10 μm) (B, n = 9) did not block the DHPG effect on Kir currents. The representative current traces (top) are taken from the time points as indicated. All the current amplitudes are normalized to the amplitude of the first evoked event.

References

    1. Aziz Q, Thomas AM, Khambra T, Tinker A. Regulation of the ATP-sensitive potassium channel subunit, Kir6.2, by a Ca2+-dependent protein kinase C. J Biol Chem. 2012;287:6196–6207. - PMC - PubMed
    1. Bolz S, Schuettauf F, Fries JE, Thaler S, Reichenbach A, Pannicke T. K+ currents fail to change in reactive retinal glial cells in a mouse model of glaucoma. Graefes Arch Clin Exp Ophthalmol. 2008;246:1249–1254. - PubMed
    1. Bringmann A, Reichenbach A. Role of Muller cells in retinal degenerations. Front Biosci. 2001;6:E72–E92. - PubMed
    1. Bringmann A, Francke M, Pannicke T, Biedermann B, Kodal H, Faude F, Reichelt W, Reichenbach A. Role of glial K+ channels in outogeny and gliosis: a hypothesis based upon studies on Müller cells. Glia. 2000;29:35–44. - PubMed
    1. Bringmann A, Pannicke T, Uhlmann S, Kohen L, Wiedemann P, Reichenbach A. Membrane conductance of Müller glial cells in proliferative diabetic retinopathy. Can J Ophthalmol. 2002a;37:221–227. - PubMed

Publication types

Substances