. 2012 Sep 12;32(37):12820-31.
doi: 10.1523/JNEUROSCI.0687-12.2012.

Activity-dependent regulation of retinogeniculate signaling by metabotropic glutamate receptors

Affiliations

Activity-dependent regulation of retinogeniculate signaling by metabotropic glutamate receptors

Gubbi Govindaiah et al. J Neurosci. .

Abstract

Thalamocortical neurons in dorsal lateral geniculate nucleus (dLGN) dynamically convey visual information from retina to the neocortex. Activation of metabotropic glutamate receptors (mGluRs) exerts multiple effects on neural integration in dLGN; however, their direct influence on the primary sensory input, namely retinogeniculate afferents, is unknown. In the present study, we found that pharmacological or synaptic activation of type 1 mGluRs (mGluR(1)s) significantly depresses glutamatergic retinogeniculate excitation in rat thalamocortical neurons. Pharmacological activation of mGluR(1)s attenuates excitatory synaptic responses in thalamocortical neurons at a magnitude sufficient to decrease suprathreshold output of these neurons. The reduction in both NMDA and AMPA receptor-dependent synaptic responses results from a presynaptic reduction in glutamate release from retinogeniculate terminals. The suppression of retinogeniculate synaptic transmission and dampening of thalamocortical output was mimicked by tetanic activation of retinogeniculate afferent in a frequency-dependent manner that activated mGluR(1)s. Retinogeniculate excitatory synaptic transmission was also suppressed by the glutamate transport blocker TBOA (dl-threo-β-benzyloxyaspartic acid), suggesting that mGluR(1)s were activated by glutamate spillover. The data indicate that presynaptic mGluR(1) contributes to an activity-dependent mechanism that regulates retinogeniculate excitation and therefore plays a significant role in the thalamic gating of visual information.


Figures

Figure 1.
Figure 1.
Activation of mGluRs dampens synaptic excitation of thalamocortical neurons. A, Example of current trace from dLGN thalamocortical neuron showing that suprathreshold OT stimulation (150 μA) elicits action potential discharge. After stable baseline (1), bath application of ACPD (100 μm, 25 s) produces membrane depolarization along with increase in action potential discharge. The membrane potential was clamped back to baseline levels by injecting DC current, and at this level, action potential firing is abolished (2). The suprathreshold response returns to control conditions following ACPD wash out (3). Vm = −69 mV. B, In a different neuron, DHPG (25 μm, 20 s) produces a membrane depolarization with inhibition of action potential discharge (1 vs 2) in a reversible manner (3). Vm = −69 mV. C, Activation of group I mGluRs suppresses EPSPs in dLGN neurons. Ci, Representative voltage traces from dLGN neuron showing EPSPs in response to OT stimulation (50 μA). Exposure to DHPG (25 μm, 20 s) produces a membrane depolarization along with suppression of the EPSP. Individual synaptic responses below illustrate EPSPs before DHPG (1), in DHPG clamped at resting membrane potential (2), and following DHPG wash out (3). Vm = −68 mV. Cii, Ciii, Histograms of EPSP amplitude (Cii) and area (Ciii) following DHPG exposure and washout. *p < 0.002. Error bars indicate SEM.
Figure 2.
Figure 2.
Activation of group I mGluRs suppress EPSCs in dLGN neurons. A, ACPD (100 μm, 20 s) markedly reduced the AMPAR (Ai) and NMDAR (Aii)-mediated EPSCs evoked by OT stimulation (0.1 Hz, 180 μA) in a reversible manner. In this and subsequent figures, individual traces are averages of five consecutive responses. Aiii, Histogram of population data showing that ACPD significantly attenuated both AMPAR- and NMDAR-mediated synaptic responses. *p < 0.001. Error bars indicate SEM. B, Group I mGluR agonist DHPG suppresses excitatory synaptic currents. Bi, Representative AMPAR-dependent EPSCs recorded before and following DHPG application. Bii, Time course of DHPG-induced attenuation of AMPAR EPSCs. DHPG produced a similar attenuation of EPSC amplitude (■) and charge (formula image
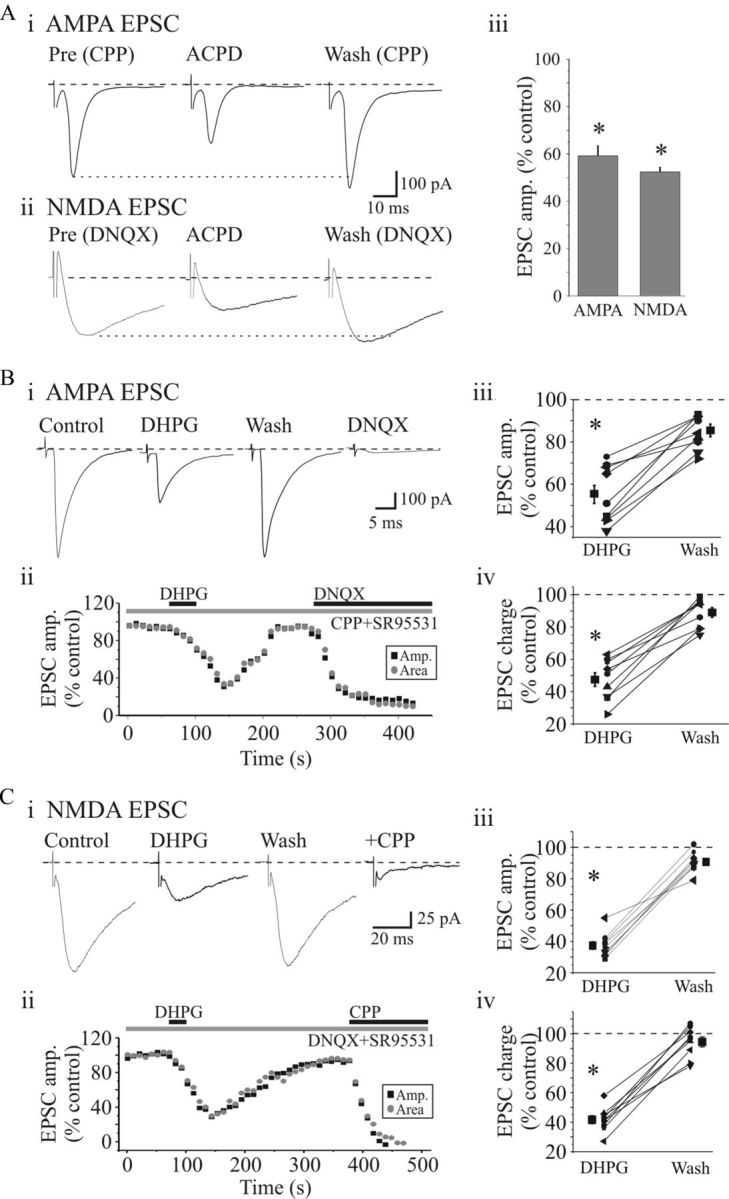
). Population data reveal a significant suppression of AMPAR EPSC amplitude (Biii) and charge (Biv) by DHPG that recovers near baseline level following washout. Ci, Representative NMDAR-dependent EPSCs recorded in presence of DNQX and SR95531. DHPG (25 μm) attenuates the NMDAR EPSC similar to that of the AMPAR EPSC. Cii, Time course of DHPG-mediated attenuation of NMDAR EPSC amplitude (■) and charge (formula image) that recovers to baseline levels following washout. NMDAR EPSCs were attenuated by d-CPP (10 μm). Population data show a significant attenuation of NMDAR EPSC amplitude (Ciii) and charge (Civ) by DHPG. *p < 0.001.
Figure 3.
Figure 3.
Activation of mGluR1, but not mGluR5, depresses EPSCs in dLGN neurons. Ai, Sample current traces revealing that the DHPG-induced suppression of NMDAR EPSC is attenuated in the presence of selective mGluR1 antagonist LY367385 (100 μm). Aii, Time course of DHPG-induced depression of EPSC and antagonistic effect of LY367385. Aiii, Histogram of population data showing that the DHPG attenuates the NMDAR EPSC, which is completely blocked by LY367385 (n = 7). Aiv, Summary data indicating that suppression of NMDAR EPSC by DHPG is unaltered by the selective mGluR5 antagonist MPEP (50 μm; n = 5). *p > 0.001. Bi, Representative current traces showing suppression of NMDAR EPSCs by DHPG and antagonistic effect of a noncompetitive mGluR1 antagonist CPCCOEt (150 μm). Bii, Graph illustrating the time course of DHPG-induced depression and antagonistic effect of CPCCOEt. Biii, Histogram of population data depicting a significant suppression of NMDAR EPSC by DHPG; this effect is blocked in the presence of CPCCOEt (n = 5). *p > 0.5. Error bars indicate SEM.
Figure 4.
Figure 4.
Activation of mGluR1 inhibits synaptic responses evoked by suprathreshold stimulation of OT. Top, Representative voltage trace recorded from dLGN neuron. Transient in trace are responses to suprathreshold OT stimulation (200 μA, 0.1 Hz). DHPG induces membrane depolarization along with suppression of synaptic responses. Following recovery, mGluR1 antagonist LY367385 (100 μm) was bath applied for 10 min, and subsequent DHPG application produces membrane depolarization but did not alter synaptic responses. Below are examples of individual synaptic responses before (1), during (2), and after DHPG exposure (3), and during DHPG in LY367385 (4).
Figure 5.
Figure 5.
mGluR1-mediated depression of synaptic transmission is a presynaptic phenomenon. Ai, Paired-pulse stimulation of OT (50 ms ISI) resulted in paired-pulse depression of the AMPAR EPSCs in thalamocortical neurons. DHPG (25 μm) attenuates EPSC1 and EPSC2 to differing degrees. Aii, Time course of DHPG-induced depression on EPSC1 (■) and EPSC2 (formula image
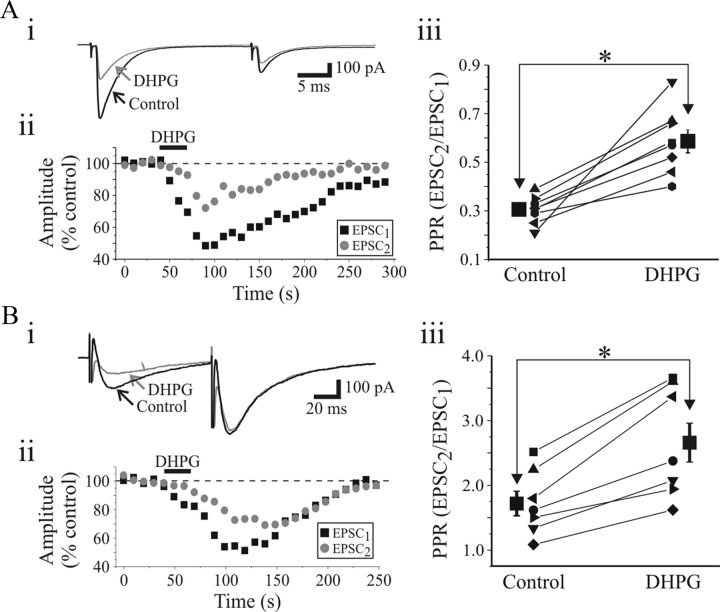
). Aiii, Population data reveal that paired-pulse ratio (PPR = EPSC2/EPSC1) is significantly increased after DHPG application. Bi, In a different neuron, paired-pulse stimulation of OT (75 ms ISI) produces a facilitation of NMDAR EPSCs. DHPG (25 μm) depresses EPSC1 and EPSC2 to a different degree. Bii, Time course of DHPG-induced depression on EPSC1 (■) and EPSC2 (formula image). Biii, Population data reveal that DHPG significantly increases the PPR. * p < 0.01.
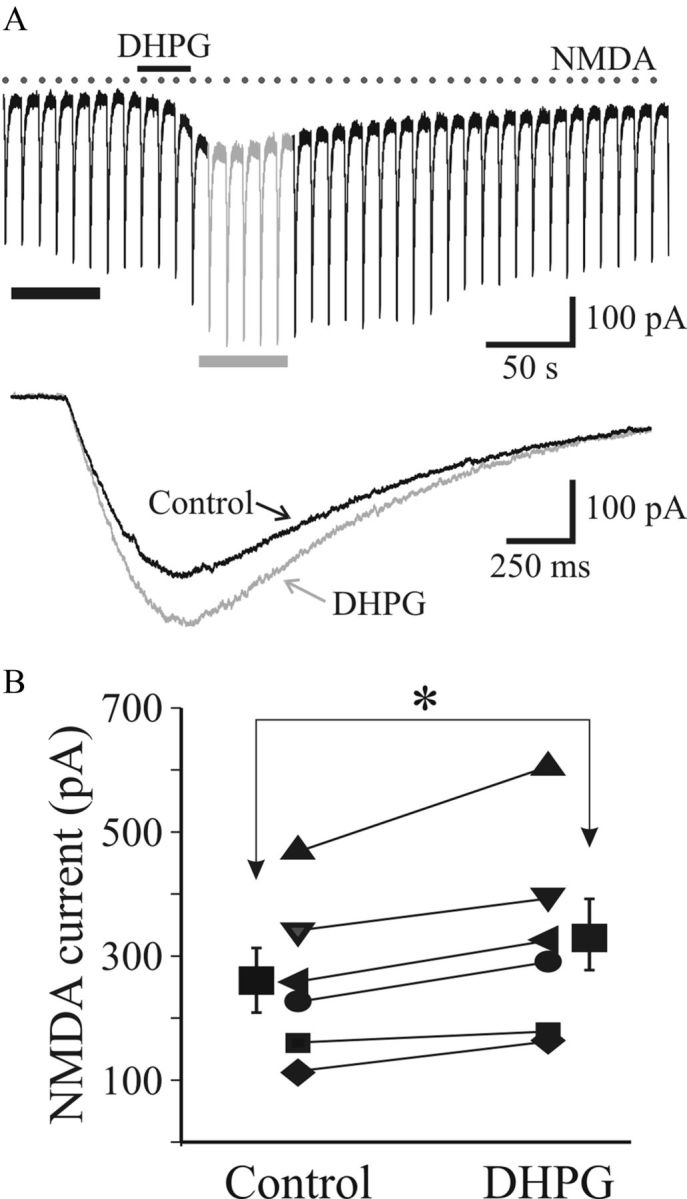
Figure 6.
Figure 6.
DHPG does not alter postsynaptic NMDA currents. A, Current trace revealing NMDAR-mediated currents elicited by repeated focal application of NMDA (200 μm) using pressure ejection via glass pipettes (2 psi, 10 ms, 0.1 Hz) in TTX (1 μm). Bottom, Average traces of five consecutive responses before (■) and following DHPG exposure (▩). B, Histogram illustrating that DHPG produces a significant increase in NMDA currents (n = 6). *p < 0.001.
Figure 7.
Figure 7.
Activation of mGluR1 regulates retinogeniculate transmission in a frequency-dependent manner. Ai, Representative voltage trace from relay neuron showing suprathreshold synaptic responses to OT stimulation (0.1 Hz, 300 μA). After obtaining a stable synaptic response with single shock stimulation (0.1 Hz), low-frequency trains were applied (300 μA, 10 Hz, 10 pulses, 3 trains, 1 s interval). Examples of traces before (control), immediately after 10 Hz stimulation (posttrain, 10 s after train), and 90 s after stimulation (recovery, 120 s after train) are shown. Low-frequency OT stimulation does not inhibit synaptic responses. Aii, Representative voltage traces before (control), immediately after high-frequency stimulation (200 Hz, 10 pulses, 3 trains, 1 s interval, posttrain, 10 s after train), and after recovery (recovery, 120 s posttrain). Note the suppression of suprathreshold output following the high-frequency OT stimulation. Bi, Examples of NMDAR-dependent EPSCs before and after high-frequency tetanic OT stimulation (200 Hz, 300 μA, 10 pulses, 3–5 trains, 1 s interval). Bii, Time course illustrating that high-frequency tetanic stimulation attenuates the NMDAR EPSC in a reversible manner. S, Single; T, tetanus. C, Population data indicating the frequency-dependent suppression of NMDAR EPSC (n = 8). D, Attenuation of NMDAR EPSC by high-frequency tetanic stimulation is mediated by mGluR1. Representative NMDAR EPSCs (Di) and plot of time course of the experiment (Dii) indicate that the mGluR1 antagonist CPCCOEt (150 μm) blocks the high-frequency (200 Hz) tetanic stimulation-induced depression of EPSC. E, Histogram of population data depicting the sensitivity of the tetanic-induced suppression of the NMDAR ESPC to the selective mGluR1 antagonist CPCCOEt (n = 4). *p < 0.05. Error bars indicate SEM.
Figure 8.
Figure 8.
Blockade of mGluR1 reduces PPD during high-frequency stimulation. Ai, Representative current traces reveal marked reduction in second pulse and subsequent leveling of the EPSC amplitude with tetanic stimulation of OT (20 Hz, 75 μA, 10 pulses) in control (black) and in presence of mGluR1 antagonist LY367385 (100 μm, gray). Right, Examples of first two synaptic responses of the tetanus (EPSC1 and EPSC2) at expanded timescale. Synaptic responses were evoked in the presence of SR95531. Aii, Graph revealing frequency-dependent suppression of the EPSC (normalized to initial EPSC) before (control, black) and in the presence of LY367385 (gray). Aiii, Population data reveal no significant alterations in PPR by mGluR1 antagonists (n = 5; paired t test). Bi, Representative current traces in response to high-frequency stimulation (100 Hz, 75 μA, 10 pulses) before (black) and in presence of LY367385 (100 μm; gray). Expanded EPSC1 and EPSC2 are shown at right. Note the marked increase in PPR in LY367385. Bii, Graph illustrating the frequency-dependent suppression before (control, black) and in the presence of LY367385. Biii, Population data reveal a significant increase in PPR by mGluR1 antagonists (n = 5; paired t test). *p < 0.02.
Figure 9.
Figure 9.
Glutamate spillover activates extrasynaptic mGluR1 at retinogeniculate synapses. Ai, Representative AMPAR-mediated EPSCs evoked by OT stimulation (0.1 Hz, 125 pA). Exposure to DHPG results in significant suppression of the EPSC that recovers following washout. Subsequent application of the glutamate uptake inhibitor dl-TBOA (30 μm) also reduces the EPSC in the same neurons. Aii, Histogram of population data illustrating that both DHPG (25 μm) and TBOA (30 μm) suppress the AMPAR EPSC amplitudes. *p < 0.0002. B, LY367385 blocks the suppressive actions of TBOA. Bi, Representative synaptic responses showing TBOA-induced suppression of EPSC that is subsequently blocked by mGluR1 antagonist LY367385. Bii, Time course of TBOA effects and partial antagonistic effects of LY367385 on the TBOA-induced suppression of the EPSC. C, Histogram of population data reveals that the suppressive actions of TBOA on EPSC is significantly reduced in the presence of LY367385 (n = 5). *p < 0.01. Error bars indicate SEM.

References

    1. Alexander GM, Godwin DW. Presynaptic inhibition of corticothalamic feedback by metabotropic glutamate receptors. J Neurophysiol. 2005;94:163–175. - PubMed
    1. Arnth-Jensen N, Jabaudon D, Scanziani M. Cooperation between independent hippocampal synapses is controlled by glutamate uptake. Nat Neurosci. 2002;5:325–331. - PubMed
    1. Augustinaite S, Heggelund P. Changes in firing pattern of lateral geniculate neurons caused by membrane potential dependent modulation of retinal input through NMDA receptors. J Physiol. 2007;582:297–315. - PMC - PubMed
    1. Chen C, Regehr WG. Developmental remodeling of the retinogeniculate synapse. Neuron. 2000;28:955–966. - PubMed
    1. Chen C, Regehr WG. Presynaptic modulation of the retinogeniculate synapse. J Neurosci. 2003;23:3130–3135. - PMC - PubMed

Publication types

LinkOut - more resources