. 2012 Sep 12;32(37):12885-95.
doi: 10.1523/JNEUROSCI.2252-12.2012.

Live imaging of targeted cell ablation in Xenopus: a new model to study demyelination and repair

Affiliations

Live imaging of targeted cell ablation in Xenopus: a new model to study demyelination and repair

Ferdinand Kaya et al. J Neurosci. .

Abstract

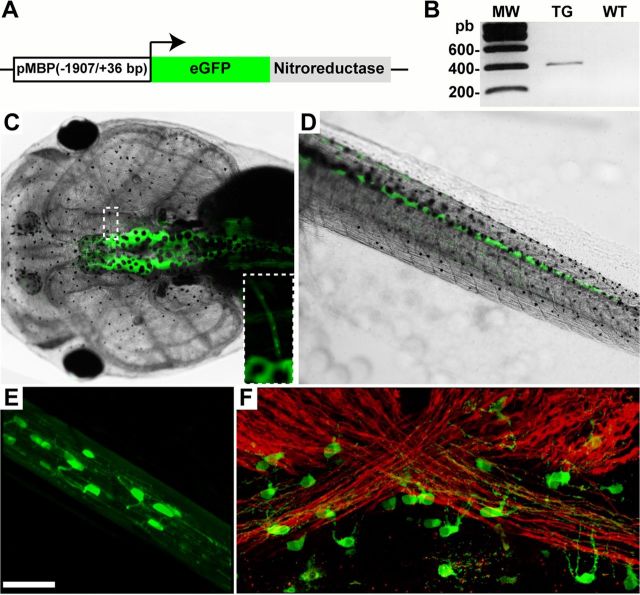
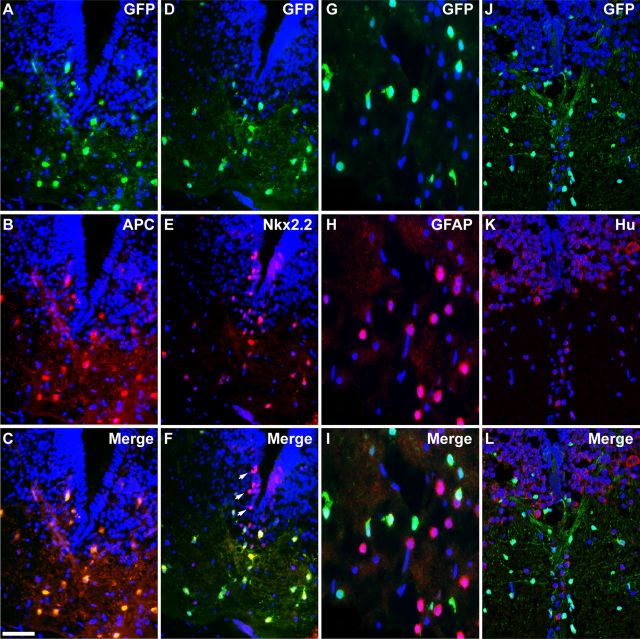
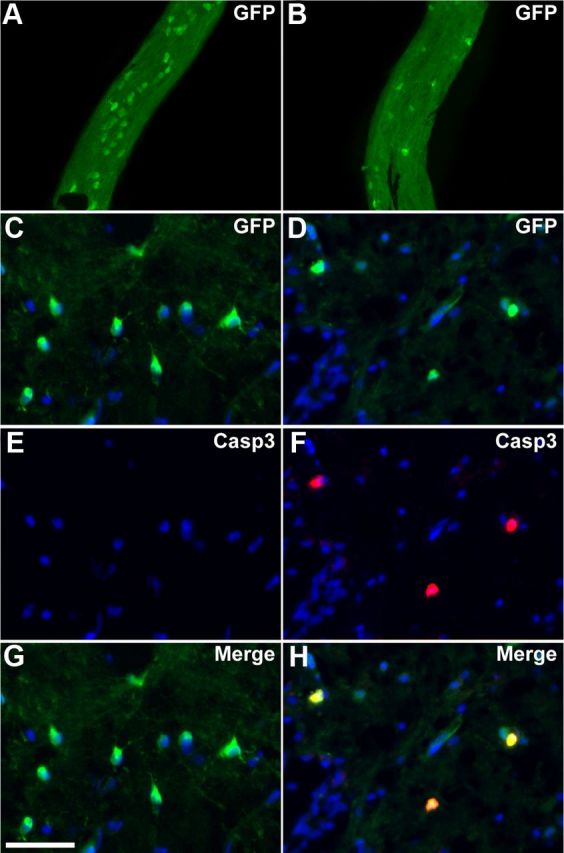
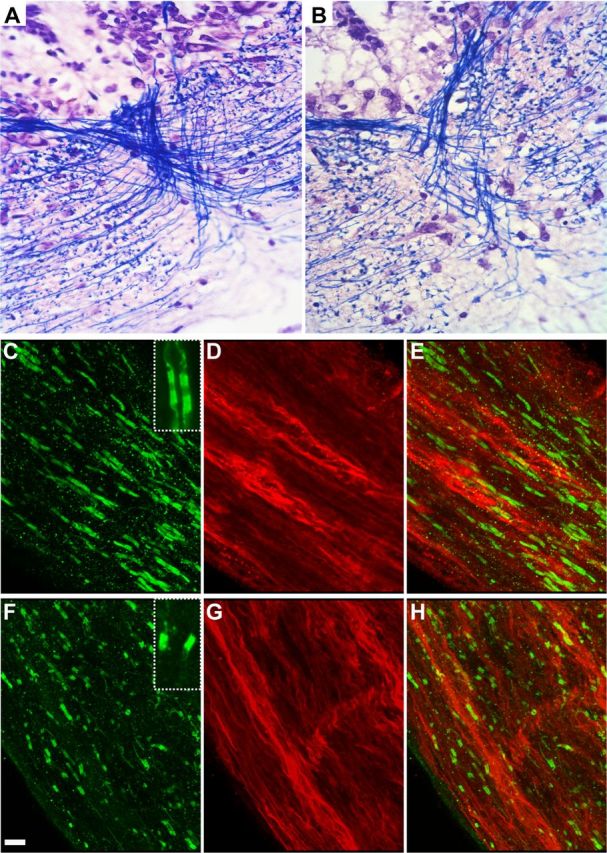
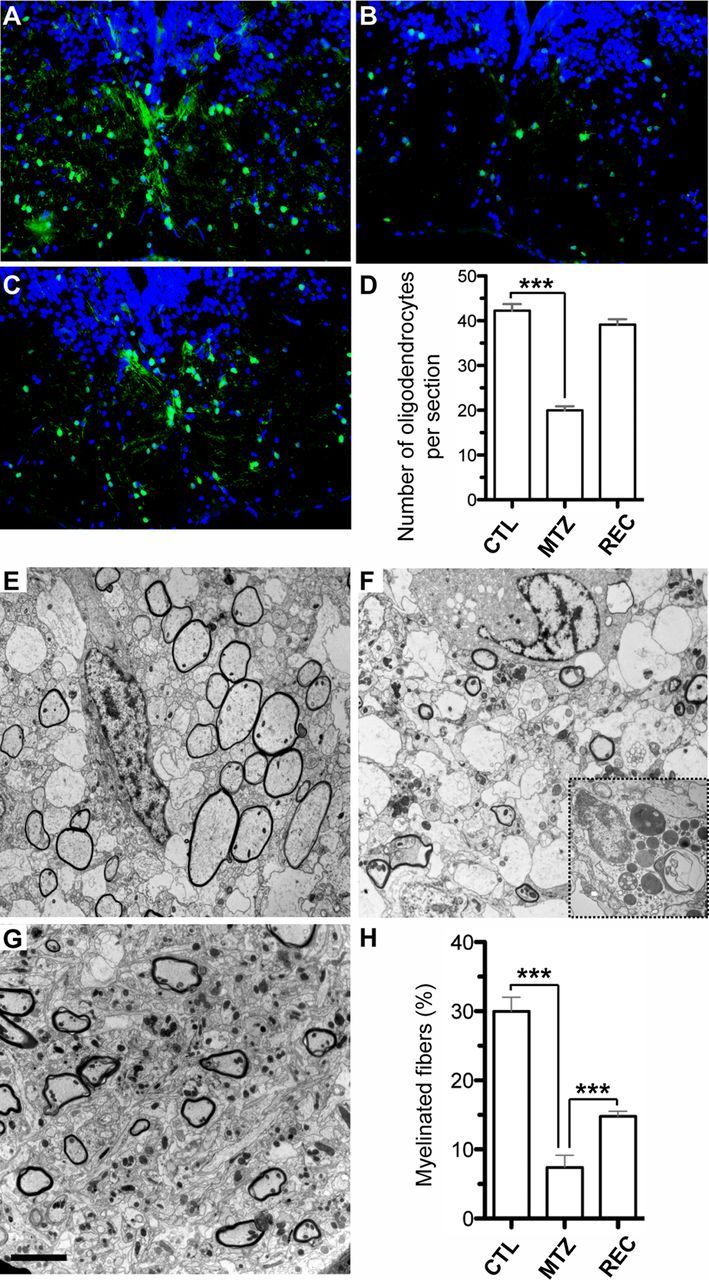
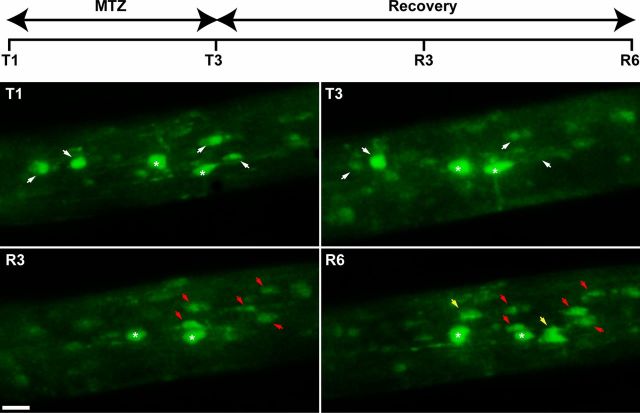
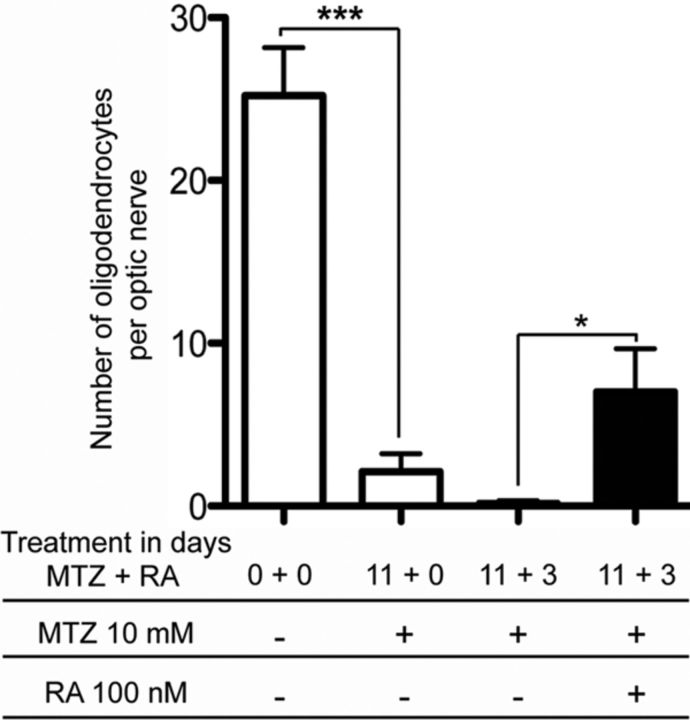
Live imaging studies of the processes of demyelination and remyelination have so far been technically limited in mammals. We have thus generated a Xenopus laevis transgenic line allowing live imaging and conditional ablation of myelinating oligodendrocytes throughout the CNS. In these transgenic pMBP-eGFP-NTR tadpoles the myelin basic protein (MBP) regulatory sequences, specific to mature oligodendrocytes, are used to drive expression of an eGFP (enhanced green fluorescent protein) reporter fused to the Escherichia coli nitroreductase (NTR) selection enzyme. This enzyme converts the innocuous prodrug metronidazole (MTZ) to a cytotoxin. Using two-photon imaging in vivo, we show that pMBP-eGFP-NTR tadpoles display a graded oligodendrocyte ablation in response to MTZ, which depends on the exposure time to MTZ. MTZ-induced cell death was restricted to oligodendrocytes, without detectable axonal damage. After cessation of MTZ treatment, remyelination proceeded spontaneously, but was strongly accelerated by retinoic acid. Altogether, these features establish the Xenopus pMBP-eGFP-NTR line as a novel in vivo model for the study of demyelination/remyelination processes and for large-scale screens of therapeutic agents promoting myelin repair.


Figures

Figure 1.
Figure 1.
Structure and expression of the pMBP-eGFP-NTR transgene. A, Schematic diagram of the pMBP-eGFP-NTR construct. The transgene contains the eGFP open reading frame fused to that of E. coli NTR placed under the control of the DNA regulatory sequence of the murine MBP gene (−1907 bp and +36 bp). B, RT-PCR performed on RNA extracted from brains of transgenic (TG) or wild-type (WT) tadpoles used to amplify a 394 bp fragment corresponding to the junction of eGFP/NTR sequence. C–F, Transgene expression as assessed by GFP fluorescence (C–E) or immunolabeling (F) in a pMBP-eGFP-NTR transgenic tadpole at stage 55. Dorsal view of the head (C) and sagittal view of the tail (D). Expression is only observed in the CNS (brain and spinal cord) but not in the peripheral nervous system. Inset in C is a higher magnification to illustrate the detection of GFP in the optic nerve. E, In vivo stack of images of the optic nerve obtained by two-photon microscopy. Note the fluorescent processes of the GFP+ cells. F, Confocal image of a whole mount of the optic chiasm immunostained for MBP (red) and GFP (green). Note the GFP+ cell bodies extending their processes toward the strongly MBP+ myelinated fibers. Scale bar (in E) C, D, 2 mm; E, F, 50 μm; inset (C), 1 mm.
Figure 2.
Figure 2.
The pMBP-eGFP-NTR transgene drives expression in mature oligodendrocytes. Coronal tissue sections across the medulla of pMBP-eGFP-NTR tadpole at stage 55 coimmunostained for GFP and successive markers of different cells types. A–C, GFP and APC, a specific marker of mature oligodendrocytes. Note the complete overlap of GFP labeling with that of APC. D–F, GFP and Nkx2.2, a marker of progenitor of oligodendrocytes and mature oligodendrocytes. Note that cells doubly labeled for GFP and Nkx2.2 are localized in the white matter tract, with no GFP detection in Nkx2.2+ progenitors in the ventral ventricular layer (white arrows in F). G–I, GFP and GFAP, a marker of astrocytes. J–L, GFP and Hu, a pan-neuronal marker. Note the complete exclusion of GFP labeling with either GFAP (I) or Hu (L). Scale bar (in C) A–F, J–L, 50 μm; G–I, 25 μm.
Figure 3.
Figure 3.
Oligodendrocyte depletion and apoptosis in transgenic tadpoles following MTZ treatment. A, B, Whole-mount two-photon microscopy of the optic nerve at stage 55 showing GFP+ cells in transgenic animals untreated (A) or MTZ-treated for 3 d (B). MTZ induced a severe depletion of GFP+ cells in the optic nerve. C–H, Immunolabeling for GFP and activated caspase3 (Casp3) on coronal sections across the medulla in untreated (C, E, G) or MTZ-treated (D, F, H) transgenic animals. In MTZ-treated animals, activated caspase3 is detected in GFP+ cells. Scale bar (in G) A, B, 150 μm; C–H, 50 μm.
Figure 4.
Figure 4.
MTZ treatment induces demyelination without axonal damage. A, B, Myelinated fibers staining with Luxol fast blue on coronal sections across the medulla at stage 55 in untreated (A) or MTZ-treated (B) transgenic animals. C–H, Whole mount of optic nerve at stage 55 immunostained for neurofascin (green) and SMI-31 (red) in untreated (C–E) or MTZ-treated (F–H) transgenic animals. Insets in C and F are high magnifications of nodes of Ranvier showing a strong signal for NF 155 in the paranodal domain and a weaker signal in the node (NF186) in a control animal (C), where in case of partial demyelination, only hemiparanodes are labeled (F). MTZ treatment induced demyelination, characterized by disorganization of the neurofascin+ nodes of Ranvier (F, H) with numerous heminodes compared with control (C, E). In MTZ-treated tadpoles, SMI-31 axons had a normal appearance (G, compared with D), suggesting that MTZ-induced demyelination does not affect the axons. Scale bar (in F) A, B, 17 μm; C–H, 5 μm; insets (C, F), 2 μm.
Figure 5.
Figure 5.
Quantification of oligodendrocyte depletion, demyelination and recovery after cessation of MTZ treatment. A–D, GFP immunostaining of coronal sections across the medulla of stage 55 pMBP-eGFP-NTR tadpoles untreated (A), treated for 6 d with 10 mm MTZ (B), and after 6 d of recovery following treatment cessation (C). D, Quantification of the number of oligodendrocytes (GFP+ cells) per section in control (CTL) MTZ-treated (MTZ) and after recovery (REC) (n = 6 tadpoles for each condition, ***p < 0.0001). E–H, Electron micrograph across the medulla of stage 55 transgenic tadpole untreated (E) or MTZ-treated for 6 d (F). Following MTZ treatment, most of the myelinated fibers disappeared and the demyelinated areas were invaded by macrophages filled with lipid droplets and myelin debris (inset in F). Note the normal morphological appearance of axons in MTZ-treated tadpoles. G, Six days after treatment cessation a large number of axons are remyelinated. H, Quantification of myelinated axons expressed as percentage of total axons (n = 3800 fibers scored per animal, ***p < 0.0001). Scale bar (in G) A–C, 50 μm; E–G, 4 μm; inset (F), 0.4 μm.
Figure 6.
Figure 6.
Live imaging of oligodendrocyte depletion and reappearance following MTZ treatment and cessation. Successive observation of the optic nerve of the same transgenic tadpole by two-photon microscopy. Transgenic tadpoles at stage 55 were treated for 3 d with MTZ (10 mm) (T1, T3), then returned to normal water for 6 d. Observations were before treatment (T1), after 3 d in the presence of MTZ (T3) and during recovery at 3 and 6 d in normal water (R3, R6). White arrows in T1 and T3 point to oligodendrocytes that disappear with MTZ treatment. White asterisks indicate oligodendrocytes that survive the treatment. One cell, which was still seen at T3, had disappeared in R3. In R3, red arrows point to new GFP+ cells that have appeared, during the first 3 d of recovery. Yellow arrows in R6 indicate additional GFP+ cells that have been generated between 3 and 6 d of recovery. Scale bar, 15 μm.
Figure 7.
Figure 7.
Retinoic acid improves spontaneous oligodendrocyte recovery. pMBP-eGFP-NTR tadpoles at stage 50 were treated for 11 d with MTZ (10 mm), then put either in fresh water or in water containing 13-cis-retinoic acid (100 nm) for 3 additional days. GFP+ cells were counted in vivo on the optic nerve. Note that in the control animal the number of GFP+ cells continued to decrease even 3 d after cessation of MTZ treatment, in contrast to tadpoles exposed to retinoic acid (n = 6, p < 0.03). *p < 0.05 and ***p < 0.001, significant differences.

References

    1. Ainger K, Avossa D, Diana AS, Barry C, Barbarese E, Carson JH. Transport and localization elements in myelin basic protein mRNA. J Cell Biol. 1997;138:1077–1087. - PMC - PubMed
    1. Bailey SM, Knox RJ, Hobbs SM, Jenkins TC, Mauger AB, Melton RG, Burke PJ, Connors TA, Hart IR. Investigation of alternative prodrugs for use with E. coli nitroreductase in ‘suicide gene’ approaches to cancer therapy. Gene Ther. 1996;3:1143–1150. - PubMed
    1. Baker D, Gerritsen W, Rundle J, Amor S. Critical appraisal of animal models of multiple sclerosis. Mult Scler. 2011;17:647–657. - PubMed
    1. Batoulis H, Recks MS, Addicks K, Kuerten S. Experimental autoimmune encephalomyelitis—achievements and prospective advances. APMIS. 2011;119:819–830. - PubMed
    1. Bhat RV, Axt KJ, Fosnaugh JS, Smith KJ, Johnson KA, Hill DE, Kinzler KW, Baraban JM. Expression of the APC tumor suppressor protein in oligodendroglia. Glia. 1996;17:169–174. - PubMed

Publication types

MeSH terms

LinkOut - more resources