. 2012 Dec;86(23):12806-15.
doi: 10.1128/JVI.01002-12. Epub 2012 Sep 12.

An interaction between human papillomavirus 16 E2 and TopBP1 is required for optimum viral DNA replication and episomal genome establishment

Affiliations

An interaction between human papillomavirus 16 E2 and TopBP1 is required for optimum viral DNA replication and episomal genome establishment

Mary M Donaldson et al. J Virol. 2012 Dec.

Abstract

In human papillomavirus DNA replication, the viral protein E2 forms homodimers and binds to 12-bp palindromic DNA sequences surrounding the origin of DNA replication. Via a protein-protein interaction, it then recruits the viral helicase E1 to an A/T-rich origin of replication, whereupon a dihexamer forms, resulting in DNA replication initiation. In order to carry out DNA replication, the viral proteins must interact with host factors that are currently not all known. An attractive cellular candidate for regulating viral replication is TopBP1, a known interactor of the E2 protein. In mammalian DNA replication, TopBP1 loads DNA polymerases onto the replicative helicase after the G(1)-to-S transition, and this process is tightly cell cycle controlled. The direct interaction between E2 and TopBP1 would allow E2 to bypass this cell cycle control, resulting in DNA replication more than once per cell cycle, which is a requirement for the viral life cycle. We report here the generation of an HPV16 E2 mutant compromised in TopBP1 interaction in vivo and demonstrate that this mutant retains transcriptional activation and repression functions but has suboptimal DNA replication potential. Introduction of this mutant into a viral life cycle model results in the failure to establish viral episomes. The results present a potential new antiviral target, the E2-TopBP1 interaction, and increase our understanding of the viral life cycle, suggesting that the E2-TopBP1 interaction is essential.


Figures
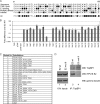
Fig 1
Fig 1
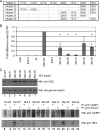
Identification of a non-TopBP1 interacting E2 mutant. (A) Residues between E2 amino acids 50 to 100 that interact with Brd4 and E1, amino acids shown previously to be multiply defective, indicating improper folding, and amino acids involved in the homodimerization of the E2 protein are highlighted by row as indicated. The remaining amino acids were TopBP1 interaction candidates. (B) A panel of mutants was prepared, and DNA replication assays were carried out in 293T cells with 100 ng of input E2 plasmid. Please note the logarithmic scale, demonstrating poor replication by mutants 7 and 17, and no replication by mutant 8. (C) A table describing the mutants used in panel B. (D) Mutant 8 does not interact efficiently with TopBP1 in vivo. Lanes 1 and 2 show the levels of input E2 proteins for the coimmunoprecipitation experiments shown in lanes 3 and 4 with a loading control; TopBP1 is often difficult to detect in the input lanes and is not shown here. Lanes 3 and 4 are Western blots of TopBP1 immunoprecipitations. In lane 3, it is clear in the lower panel that E2WT interacts well with endogenous TopBP1, whereas mutant 8 is severely compromised, as shown in lane 5. The shadow band observed may indicate some residual binding, but there may also be a contribution to this from the “stickiness” of E2 for the beads (14, 18).
Fig 2
Fig 2
Identification of critical residues of E2 required for efficient TopBP1 interaction. (A) Panel of mutants tested for DNA replication function and TopBP1 interaction. Mutant 8 has 8 amino acid changes, and our results from Fig. 1 indicated that the region around amino acid 90 was important for DNA replication function. (B) The E2 mutants were tested for their DNA replication potential with 100 ng of input plasmid DNA in 293T cells. Mutant 8 was null for DNA replication, as demonstrated in Fig. 1, whereas mutants 25, 26, 27, and 29 were significantly reduced in their DNA replication properties compared to the wild type, as determined by a Student t test. (C) All of the mutants were expressed in 293T cells (lanes 1 to 7) and then tested for coimmunoprecipitation with TopBP1 (lanes 8 to 23); even-numbered lanes used the TopBP1 antibody, and odd-numbered lanes used preimmune serum. The upper panel demonstrates that TopBP1 was immunoprecipitated as predicted. The lower panel demonstrates an efficient coimmunoprecipitation of wild-type E2 and mutant 28 with TopBP1. Mutant 28 was the only mutant that did not show a significant reduction in DNA replication properties in panel B. Therefore, there is a correlation with failure to efficiently interact with TopBP1 and DNA replication properties for the E2 mutants.
Fig 3
Fig 3
Further characterization of E2TopBP1. Mutant 25 from Fig. 2, containing N89YE90V mutations, was called E2TopBP1. (A) E2TopBP1 was retested for interaction with TopBP1 to confirm the compromised interaction. Lanes 1 and 2 show the input levels of the E2 proteins, along with a loading control (gamma tubulin). Lanes 3 and 4 show the immunoprecipitation with TopBP1, showing the pull down of TopBP1 (top panel) and coimmunoprecipitation of E2WT (lane 3) that is compromised for E2TopBP1 binding (lane 4). (B) The ability of E2TopBP1 to bind HPV16 E1 was tested in 293T cells. Lanes 1 to 4 represent input levels of HA-E1 protein with the indicated E2 proteins; E2E39A is a known E1 noninteractor (52). Lanes 5 to 8 represent coimmunoprecipitations with an HA antibody, followed by Western blotting for HA (top panel) and E2 (bottom panel). It is clear that E2TopBP1 binds HA-E1 like E2WT, while E2E39A fails to interact as expected. (C) DNA replication assays were carried out in 293T cells with input levels of E2WT and E2TopBP1 plasmids of 10 ng. E1 was held steady at 5 μg in these assays since replication does not work well below this level (59). The results are expressed as picograms of replicated DNA detected. Below the bar chart is a summary of the actual numbers from the experiments. The results represent the average of three independent experiments. Bars represent ± the standard errors of the mean. E2TopBP1 has a significantly reduced replication potential, indicated by an asterisk (*), as determined by a Student t test. These results confirm that E2TopBP1 is compromised in TopBP1 binding and DNA replication potential, while retaining wild-type levels of interaction with E1.
Fig 4
Fig 4
E2TopBP1 retains transcription function. (A) E2WT and E2TopBP1 were titrated into 293T cells, along with an E2 reporter containing six E2 DNA binding sites upstream from a tk promoter driving luciferase (62). Cells were harvested, and luciferase and protein assays were carried out. The results are normalized to protein levels in each sample and are represented as the fold increase over no E2 expression plasmid. The boxes below the figure specify the actual fold increase. These experiments were carried out at least three times in duplicate. Bars represent ± the standard errors of the mean. The asterisk (*) indicates a significant difference between E2WT and E2TopBP1 at 10 ng of input plasmid DNA in this assay, as determined by a Student t test. (B) E2WT and E2TopBP1 were titrated into 293T cells, along with a vector containing the luciferase gene under the control of the HPV18 LCR. The cells were harvested, and luciferase and protein assays carried out. The results are normalized to protein levels in each sample and are represented as relative to no E2 expression plasmid equaling 1. These experiments were carried out at least three times in duplicate. Bars represent ± the standard errors of the mean. There were no significant differences between E2TopBP1 and E2WT at any E2 plasmid input tested.
Fig 5
Fig 5
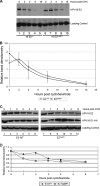
E2TopBP1 is similar in stability to E2WT with or without E1. (A) E2WT and E2TopBP1 were transfected into 293T cells. These cells had cycloheximide added to them at the time points indicated prior to protein harvesting, and the protein extracts were blotted for E2 protein levels. Shown is a typical result from three independent experiments. (B) The levels of E2 protein in the experiments represented in panel A were quantitated as described in Materials and Methods and are shown graphically with the standard errors of the mean indicated by bars. (C) Previously, we have shown that E2WT is stabilized by E1 (25), and lanes 1 to 6 demonstrate that E2 levels persist after 6 h of cycloheximide treatment as predicted. In lanes 7 to 12, the results with E2TopBP1 are shown, where it is again clear that the E2 protein levels persist after cycloheximide treatment. This experiment was repeated with equivalent results. (D) The blot shown in panel C was scanned and quantitated as described in Materials and Methods. Overall, the results demonstrate that there is no significant alteration in E2TopBP1 stability compared to E2WT either in the presence or in the absence of E1.
Fig 6
Fig 6
E2TopBP1 mutant genomes (N89YE90V in this figure) fail to establish episomes in primary human foreskin keratinocytes. (A) HPV containing cells were generated as described in Materials and Methods, and the growth rates were measured. HPV-containing cells were grown for 10 passages. Growth rates were estimated assuming that cells doubled 3.3 times per passage at a 1:10 split ratio. (B) Total DNAs from cells grown in monolayer (Mo) or methylcellulose (MC) were incubated with an enzyme that does not digest the HPV16 genome (U) or cuts it once (C) (see Materials and Methods). DNAs were then subjected to Southern blotting and assayed with a probe consisting of the full HPV16 genome. Standards corresponding to 100, 10, or 1 copy of the HPV16 genome per cell are included. Please note that the blot shown is from the same exposure of the same gel, with the gap in between demonstrating that a control was removed for clarity.
Fig 7
Fig 7
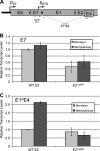
Effects of E2TopBP1 mutations on transcription from HPV16 genomes. (A) Location of the early (p97) and late (p670) promoters, the E1^E4 splice, and the PCR primers used in these experiments are shown. Total RNAs extracted from cells containing wild-type (WT) or mutant genomes grown either in monolayer or suspended in methylcellulose were subjected to RT-qPCR using primers targeting the E7 open reading frame (B) or using a TaqMan probe spanning the E1^E4 splice junction (C). The data are the means of two to three HFK backgrounds and six to nine separate PCRs and were normalized first to cyclophilin as an internal control and then to viral transcript levels in wild-type cells grown in monolayers. Bars represent ± the standard errors of the mean.

Similar articles

Cited by

References

    1. Abbate EA, Berger JM, Botchan MR. 2004. The X-ray structure of the papillomavirus helicase in complex with its molecular matchmaker E2. Genes Dev. 18:1981–1996 - PMC - PubMed
    1. Abbate EA, Voitenleitner C, Botchan MR. 2006. Structure of the papillomavirus DNA-tethering complex E2:Brd4 and a peptide that ablates HPV chromosomal association. Mol. Cell 24:877–889 - PubMed
    1. Abroi A, Ilves I, Kivi S, Ustav M. 2004. Analysis of chromatin attachment and partitioning functions of bovine papillomavirus type 1 E2 protein. J. Virol. 78:2100–2113 - PMC - PubMed
    1. Antson AA, et al. 2000. Structure of the intact transactivation domain of the human papillomavirus E2 protein. Nature 403:805–809 - PubMed
    1. Bang SW, et al. 2011. Human TopBP1 localization to the mitotic centrosome mediates mitotic progression. Exp. Cell Res. 317:994–1004 - PubMed

Publication types

MeSH terms

LinkOut - more resources