

Constraints on viral evolution during chronic hepatitis C virus infection arising from a common-source exposure
- PMID: 22973048
- PMCID: PMC3497661
- DOI: 10.1128/JVI.01440-12
Constraints on viral evolution during chronic hepatitis C virus infection arising from a common-source exposure
Abstract
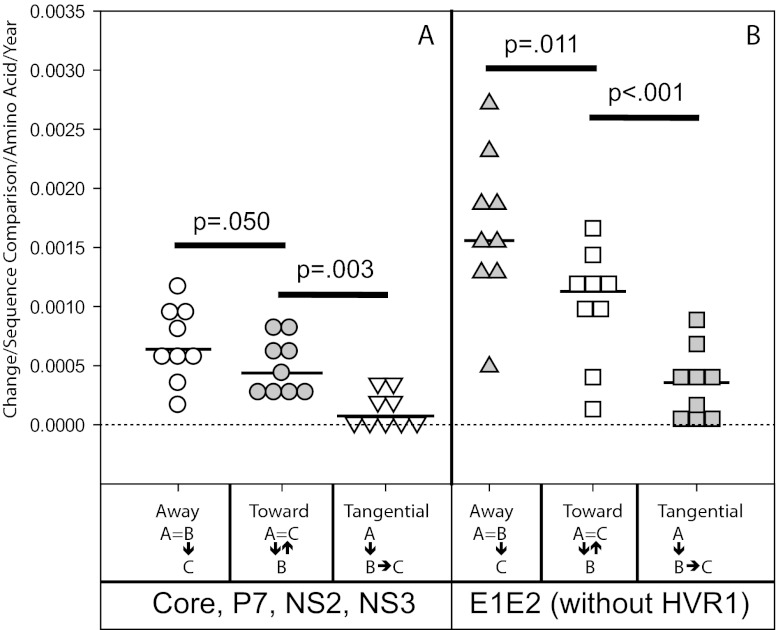
Extraordinary viral sequence diversity and rapid viral genetic evolution are hallmarks of hepatitis C virus (HCV) infection. Viral sequence evolution has previously been shown to mediate escape from cytotoxic T-lymphocyte (CTL) and neutralizing antibody responses in acute HCV infection. HCV evolution continues during chronic infection, but the pressures driving these changes are poorly defined. We analyzed plasma virus sequence evolution in 5.2-kb hemigenomes from multiple longitudinal time points isolated from individuals in the Irish anti-D cohort, who were infected with HCV from a common source in 1977 to 1978. We found phylogenetically distinct quasispecies populations at different plasma time points isolated late in chronic infection, suggesting ongoing viral evolution and quasispecies replacement over time. We saw evidence of early pressure driving net evolution away from a computationally reconstructed common ancestor, known as Bole1b, in predicted CTL epitopes and E1E2, with balanced evolution toward and away from the Bole1b amino acid sequence in the remainder of the genome. Late in chronic infection, the rate of evolution toward the Bole1b sequence increased, resulting in net neutral evolution relative to Bole1b across the entire 5.2-kb hemigenome. Surprisingly, even late in chronic infection, net amino acid evolution away from the infecting inoculum sequence still could be observed. These data suggest that, late in chronic infection, ongoing HCV evolution is not random genetic drift but rather the product of strong pressure toward a common ancestor and concurrent net ongoing evolution away from the inoculum virus sequence, likely balancing replicative fitness and ongoing immune escape.
Figures


References
-
- Alter MJ, et al. 1999. The prevalence of hepatitis C virus infection in the United States, 1988 through 1994. N. Engl. J. Med. 341:556–562 - PubMed
-
- Bhattacharya T, et al. 2007. Founder effects in the assessment of HIV polymorphisms and HLA allele associations. Science 315:1583–1586 - PubMed
-
- Bukh J, Miller RH, Purcell RH. 1995. Genetic heterogeneity of hepatitis C virus: quasispecies and genotypes. Semin. Liver Dis. 15:41–63 - PubMed
Publication types
MeSH terms
Associated data
- Actions
- Actions
- Actions
- Actions
- Actions
- Actions
- Actions
- Actions
- Actions
- Actions
- Actions
- Actions
- Actions
- Actions
- Actions
- Actions
- Actions
- Actions
- Actions
- Actions
- Actions
- Actions
- Actions
- Actions
- Actions
- Actions
- Actions
- Actions
- Actions
- Actions
- Actions
- Actions
- Actions
- Actions
- Actions
- Actions
- Actions
- Actions
- Actions
- Actions
- Actions
- Actions
- Actions
- Actions
- Actions
- Actions
- Actions
- Actions
- Actions
- Actions
- Actions
- Actions
- Actions
- Actions
- Actions
- Actions
- Actions
- Actions
- Actions
- Actions
- Actions
- Actions
- Actions
- Actions
- Actions
- Actions
- Actions
- Actions
- Actions
- Actions
- Actions
- Actions
- Actions
- Actions
- Actions
- Actions
- Actions
- Actions
- Actions
- Actions
- Actions
- Actions
- Actions
- Actions
- Actions
- Actions
- Actions
- Actions
- Actions
- Actions
- Actions
- Actions
- Actions
- Actions
- Actions
- Actions
- Actions
- Actions
- Actions
- Actions
- Actions
- Actions
- Actions
- Actions
- Actions
- Actions
- Actions
- Actions
- Actions
- Actions
- Actions
- Actions
- Actions
- Actions
- Actions
- Actions
- Actions
- Actions
- Actions
- Actions
- Actions
- Actions
- Actions
- Actions
- Actions
- Actions
- Actions
- Actions
- Actions
- Actions
- Actions
- Actions
- Actions
- Actions
- Actions
- Actions
- Actions
- Actions
- Actions
- Actions
- Actions
- Actions
- Actions
- Actions
- Actions
- Actions
- Actions
- Actions
- Actions
- Actions
- Actions
- Actions
- Actions
- Actions
- Actions
- Actions
- Actions
- Actions
- Actions
- Actions
- Actions
- Actions
- Actions
- Actions
- Actions
- Actions
- Actions
- Actions
- Actions
- Actions
- Actions
- Actions
- Actions
- Actions
- Actions
- Actions
- Actions
- Actions
- Actions
- Actions
- Actions
Grants and funding
LinkOut - more resources
Full Text Sources
Molecular Biology Databases
