

Performance limitations of relay neurons
- PMID: 22973184
- PMCID: PMC3415468
- DOI: 10.1371/journal.pcbi.1002626
Performance limitations of relay neurons
Abstract
Relay cells are prevalent throughout sensory systems and receive two types of inputs: driving and modulating. The driving input contains receptive field properties that must be transmitted while the modulating input alters the specifics of transmission. For example, the visual thalamus contains relay neurons that receive driving inputs from the retina that encode a visual image, and modulating inputs from reticular activating system and layer 6 of visual cortex that control what aspects of the image will be relayed back to visual cortex for perception. What gets relayed depends on several factors such as attentional demands and a subject's goals. In this paper, we analyze a biophysical based model of a relay cell and use systems theoretic tools to construct analytic bounds on how well the cell transmits a driving input as a function of the neuron's electrophysiological properties, the modulating input, and the driving signal parameters. We assume that the modulating input belongs to a class of sinusoidal signals and that the driving input is an irregular train of pulses with inter-pulse intervals obeying an exponential distribution. Our analysis applies to any [Formula: see text] order model as long as the neuron does not spike without a driving input pulse and exhibits a refractory period. Our bounds on relay reliability contain performance obtained through simulation of a second and third order model, and suggest, for instance, that if the frequency of the modulating input increases or the DC offset decreases, then relay increases. Our analysis also shows, for the first time, how the biophysical properties of the neuron (e.g. ion channel dynamics) define the oscillatory patterns needed in the modulating input for appropriately timed relay of sensory information. In our discussion, we describe how our bounds predict experimentally observed neural activity in the basal ganglia in (i) health, (ii) in Parkinson's disease (PD), and (iii) in PD during therapeutic deep brain stimulation. Our bounds also predict different rhythms that emerge in the lateral geniculate nucleus in the thalamus during different attentional states.
Conflict of interest statement
The authors have declared that no competing interests exist.
Figures

 . The proximal synapses (diamonds) form the driving input
  . The output is the axonal voltage
  . (B) A block diagram of a relay neuron showing two inputs and output
  .
.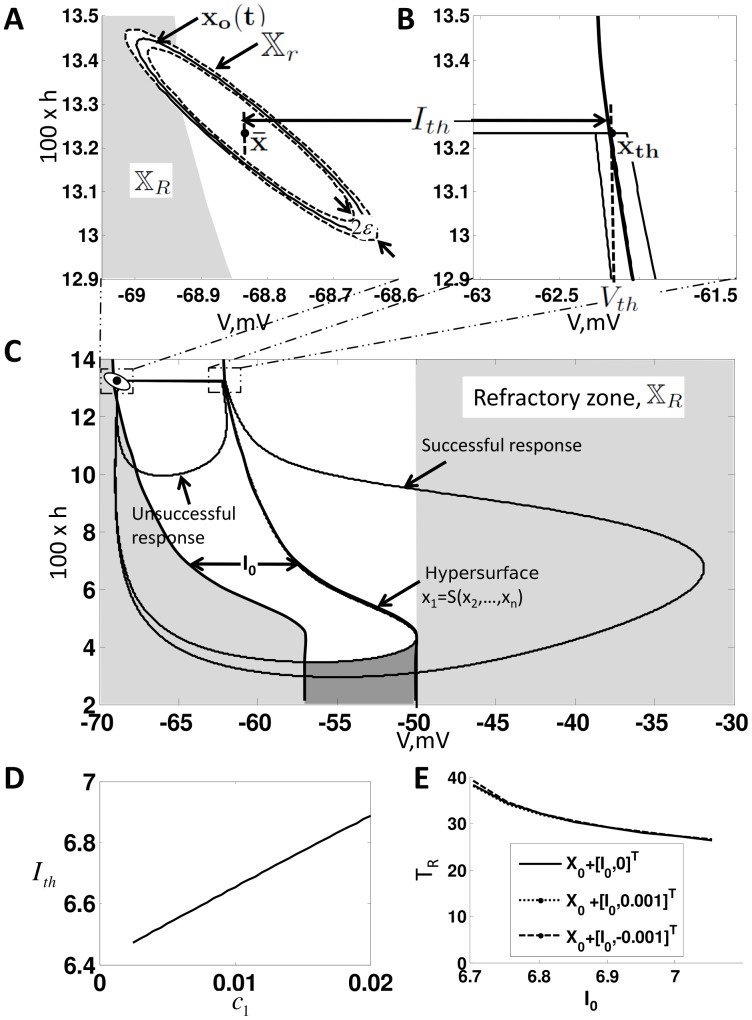
 , the steady state orbit
  and the orbit tube,
  , for
, for  given by (3) and
  . The orbit tube is shown for
  . (B) Illustrates
  , the threshold voltage
  and threshold current
  . Note that these parameters are defined by the undriven system (9). (C) Illustrates the critical hypersurface
  , a successful response trajectory, an unsuccessful response trajectory, and the refractory zone,
  for the undriven system (9). The time it takes for the solution to leave
  after generating a successful response is called the refractory period,
  . Note that refractory zone depends on
  and therefore
  also depends on
  . Additionally, note that the region shaded in the darker grey is also in the refractory zone, because if
  is in this region then
  such that
  Therefore, a successful response cannot be generated if
  is in this region by definition. (D) Dependence of
  on
on  . Note that
  is approximately a straight line with slope
  , i.e
, i.e  . (E) Illustrates
  vs
vs  and
and  .
.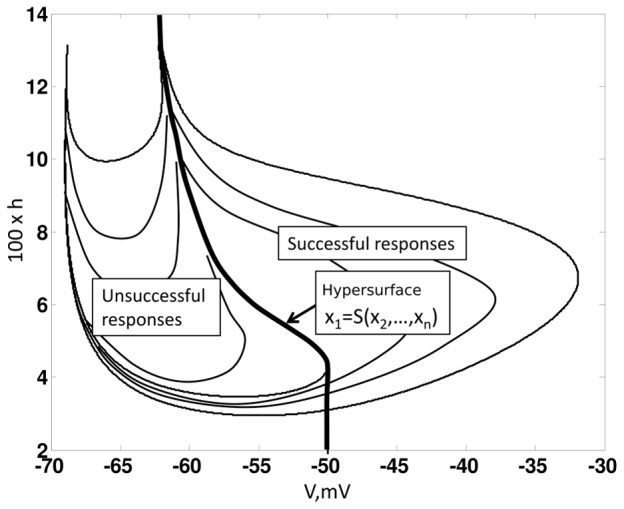
 , which defines the threshold for a successful response.(9) generates a successful response for any initial condition that is to the right of the hypersurface i.e.
  . Whereas, any initial condition to the left of the hypersurface results in unsuccessful response.
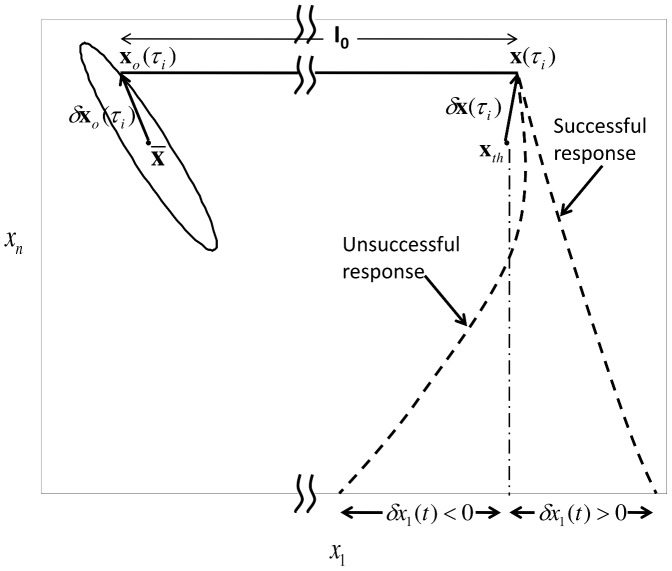
 and
and  . When an
  pulse arrives, the solution jumps from
  to
to  . Now, whether the neuron generates a successful response or not is governed by the local dynamics. Therefore, we linearize (4) about
  to analyze the behaviour of
  for
for  . If a successful response is generated,
  such that
  else if an unsuccessful response is generated
  such that
  .
.
 , with
  . The dotted lines are the lower and upper bounds on reliability from the (48) and (47), respectively. The solid line is
  calculated by running simulations of (1), and the error bars indicate
  .
.
 , with
  . B. Plots the theoretical and numerically computed reliability as a function of
  with
with  ,
,  . The dotted lines are the lower and upper bounds on reliability from the (48) and (47), respectively. The solid line is
  calculated by running simulations of (4), and the error bars indicate
  .
.
 as a function of
  B.
B.
 (see (35) versus
  and
and  . Note that
  depends largely upon
  , whereas its dependence upon
  is minimal.
  changes the maximum value of
  but does not effect it much in the high frequency range.
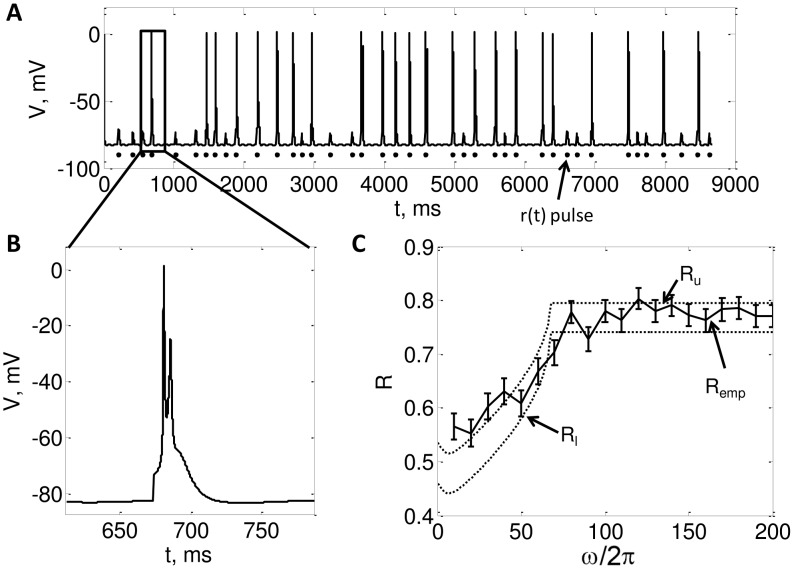
 . Note that each pulse in
  either generates a burst of spikes or does not spike at all. B. Zoomed in view of a burst. C. Plots the theoretical and numerically computed reliability as a function of
  , with
  ,
, ,
, . The dotted lines are the lower and upper bounds on reliability from the (48) and (47), respectively. The solid line is plots
  calculated by running simulations of (4), and the error bars indicate
  . We estimated
  as the minimum height of a
  pulse that makes the neuron generate a successful response.
 . Note that each pulse in
  either generates a successful spike or generates unsuccessful spike. B. Zoomed in view of a successful spike. C. Plots theoretical and numerically computed reliability versus
  , with
  ,
,  ,
,  ,
,  ,
,  ,
,  . The dotted line is plotting the lower and upper bounds on reliability from the (48) and (47), respectively. Note that here
  , therefore
  . The solid line plots
  calculated by running simulations of (4), and the error bars indicate
  . We estimated
  as the minimum height of a
  pulse that makes the neuron spike.
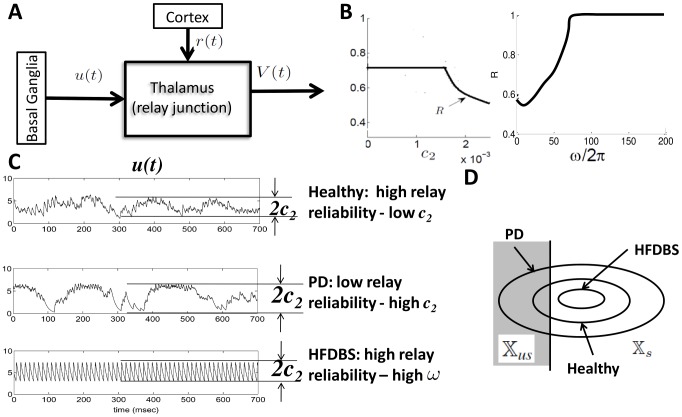
 and
and  from (49). (C) Simulations of
  (basal ganglia output) from the computational study for the Healthy, PD and PD with high frequency deep brain stimulation (HFDBS) cases. As we can see in the healthy case, the amplitude of the BG output,
  , is smaller compared to the PD BG output, resulting in a higher relay reliability. HFDBS increases the frequency,
  , of the BG output, resulting in a higher relay reliability. (D) Intuition of how reliability changes in the three cases. In PD,
  is larger, therefore, the diameter of the orbit tube is larger compared to the orbit tube for healthy. This results in more time spent in the unsuccessful response region
  , which leads to poor reliability. In contrast, in PD case with HFDBS applied,
  is larger and the gains
  decrease, which generates a smaller orbit tube. In this case, the state spends more time in the successful response region
  of the orbit tube, resulting in high reliability.
References
-
- Hirsch JC, Fourment A, Marc ME (1983) Sleep-related variations of membrane potential in the lateral geniculate body relay neurons of the cat. Brain Res 259: 308–312. - PubMed
-
- Seki K, Perlmutter SI, Fetz EE (2003) Sensory input to primate spinal cord is presynaptically inhibited during voluntary movement. Nat Neurosci 6: 1309–1316. - PubMed
-
- Guillery RW, Sherman SM (2002) Thalamic relay functions and their role in corticocortical com-munication: Generalizations from the visual system. Neuron 33: 163–176. - PubMed
Publication types
MeSH terms
Grants and funding
LinkOut - more resources
Full Text Sources
