. 2012 Aug 28:6:64.
doi: 10.3389/fncom.2012.00064. eCollection 2012.

Synaptic depression and slow oscillatory activity in a biophysical network model of the cerebral cortex

Affiliations

Synaptic depression and slow oscillatory activity in a biophysical network model of the cerebral cortex

Jose M Benita et al. Front Comput Neurosci. .

Abstract

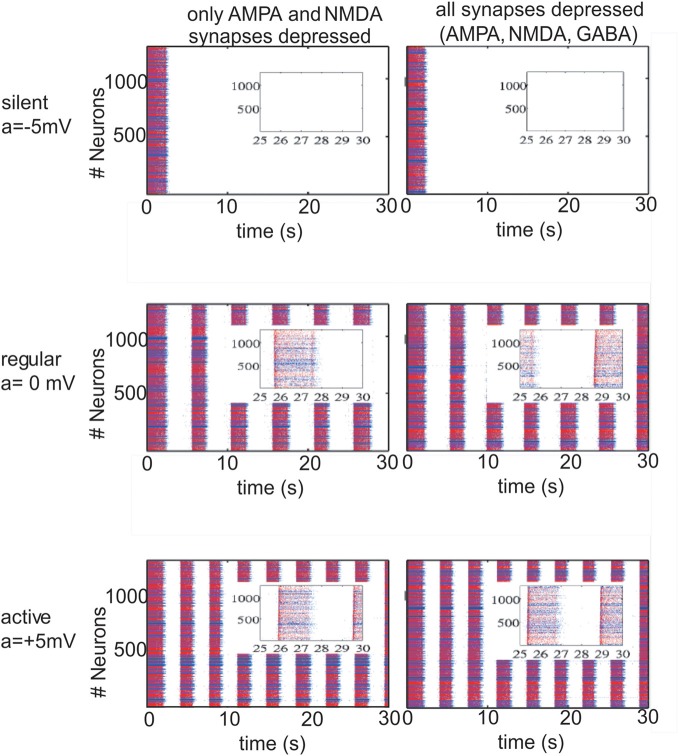
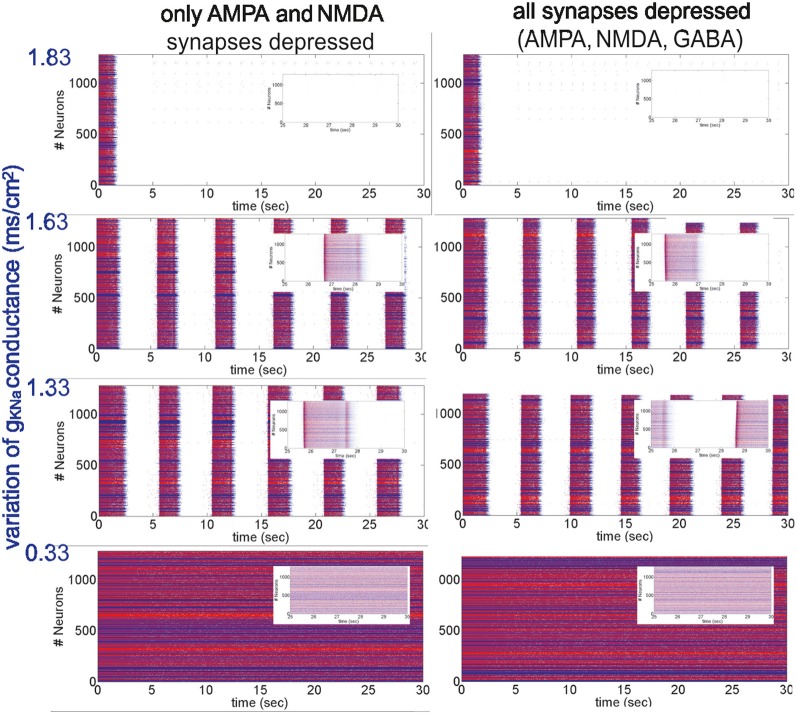
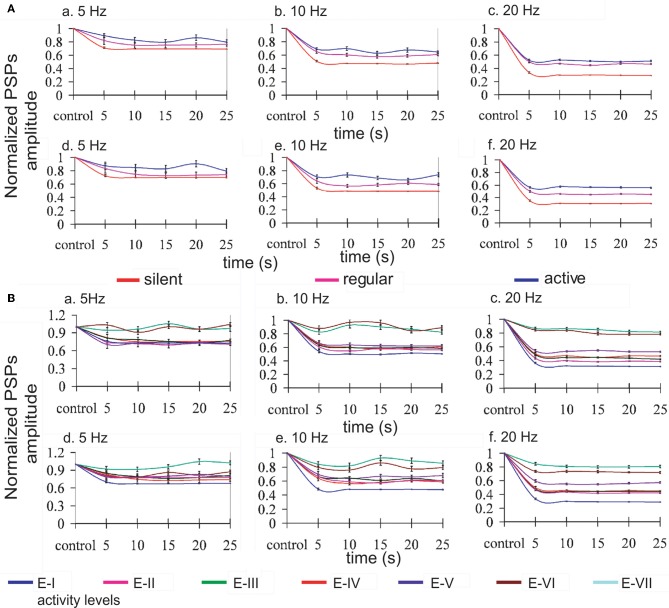
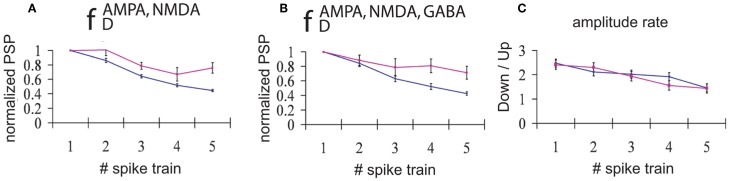
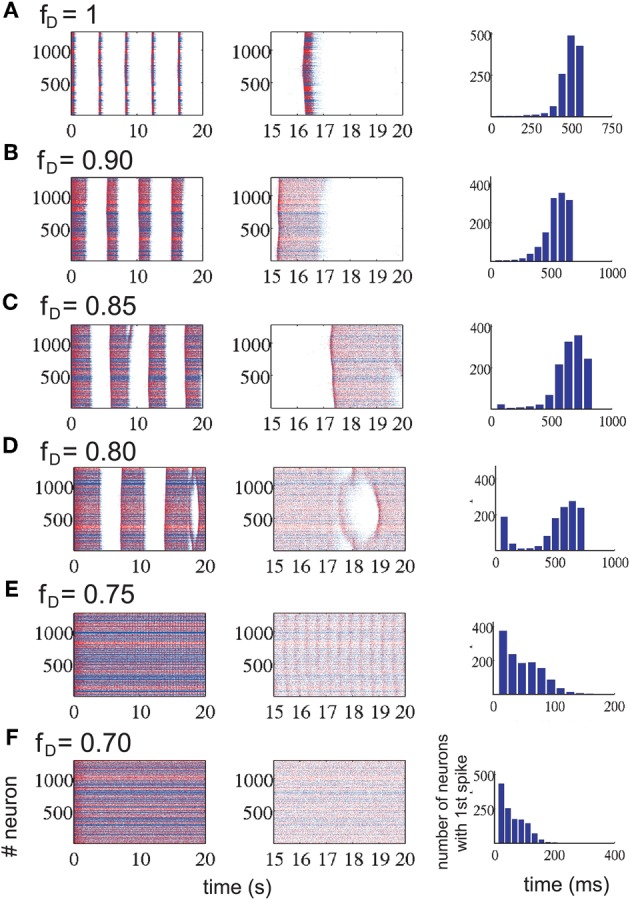
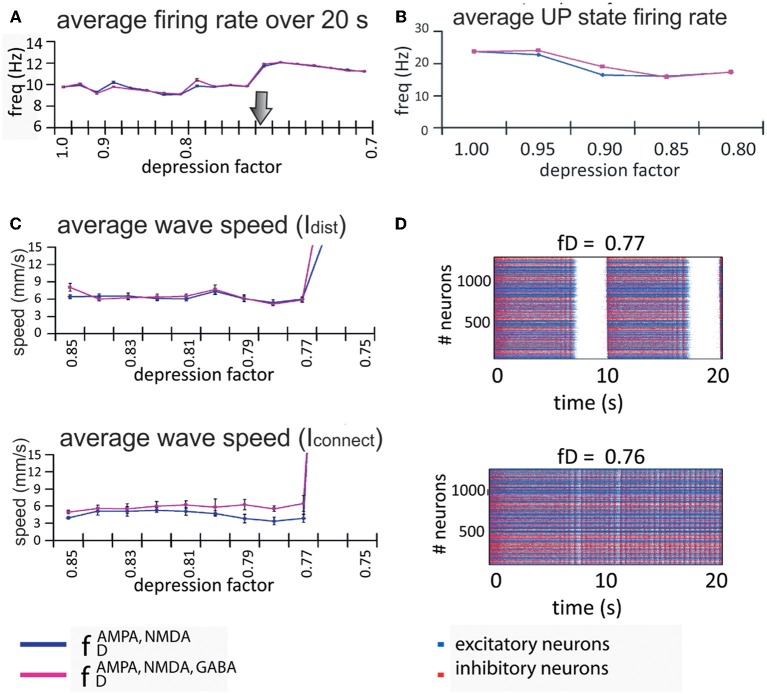
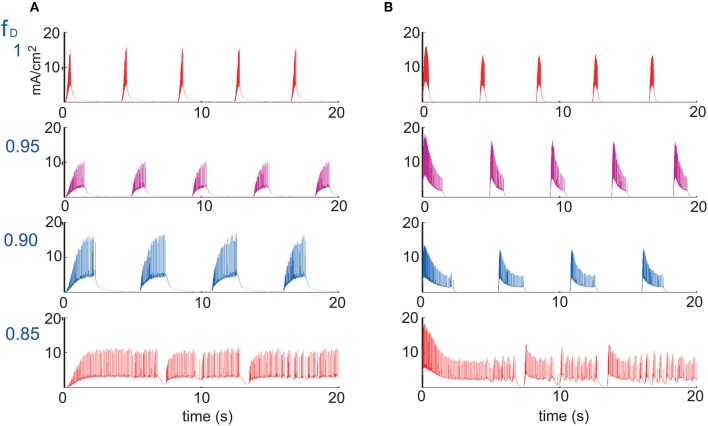
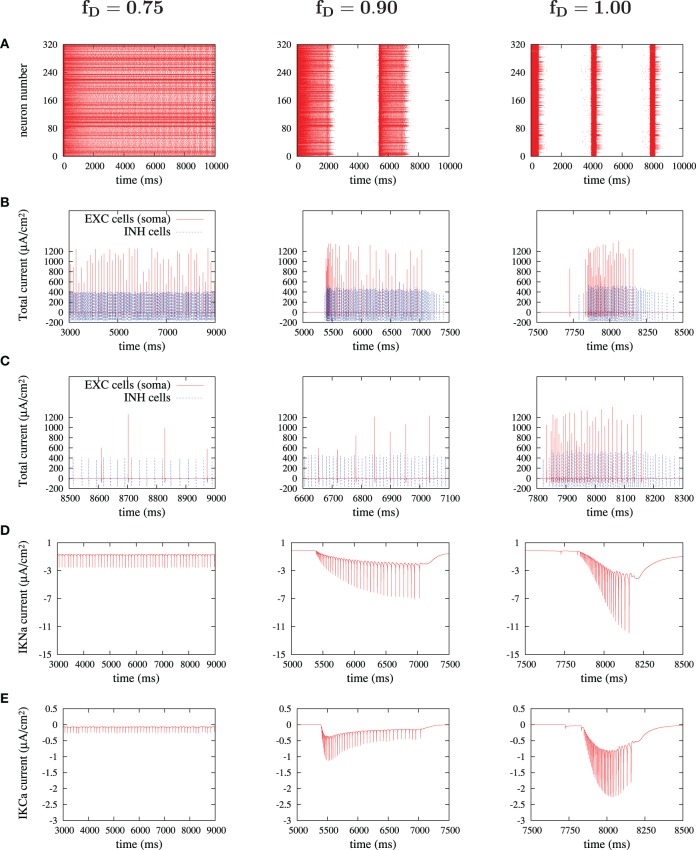
Short-term synaptic depression (STD) is a form of synaptic plasticity that has a large impact on network computations. Experimental results suggest that STD is modulated by cortical activity, decreasing with activity in the network and increasing during silent states. Here, we explored different activity-modulation protocols in a biophysical network model for which the model displayed less STD when the network was active than when it was silent, in agreement with experimental results. Furthermore, we studied how trains of synaptic potentials had lesser decay during periods of activity (UP states) than during silent periods (DOWN states), providing new experimental predictions. We next tackled the inverse question of what is the impact of modifying STD parameters on the emergent activity of the network, a question difficult to answer experimentally. We found that synaptic depression of cortical connections had a critical role to determine the regime of rhythmic cortical activity. While low STD resulted in an emergent rhythmic activity with short UP states and long DOWN states, increasing STD resulted in longer and more frequent UP states interleaved with short silent periods. A still higher synaptic depression set the network into a non-oscillatory firing regime where DOWN states no longer occurred. The speed of propagation of UP states along the network was not found to be modulated by STD during the oscillatory regime; it remained relatively stable over a range of values of STD. Overall, we found that the mutual interactions between synaptic depression and ongoing network activity are critical to determine the mechanisms that modulate cortical emergent patterns.

Keywords: cortical activity; network model; short-term depression; synaptic plasticity; up/down state.


Figures

Figure 1
Figure 1
Different patterns of network activity given by different potassium reversal potential values (VpyrK = −100 + a mV, VinhK = −90 + a mV). Left column, excitatory synaptic connections depressed (fAMPA,NMDAD = 0.9); right column, excitatory and inhibitory synaptic connections depressed (fAMPA,NMDA,GABAAD = 0.9). Inset figures show the last 5 s of each simulation, respectively. Red (blue) dots correspond to excitatory (inhibitory) neurons, with their actual position in the model network. Upper row panels represent a silent network after the transient period with VpyrK = −105 mV, VinhK = −95 mV. The middle row panels represent a regular network activity, VpyrK = −100 mV, VinhK = −90 mV, slow oscillation frequency of 0.2 Hz and a firing frequency during UP states of 17 Hz (left panel) and 18 Hz (right panel). Lower row represents a more active network as a result of changing VpyrK = −95 mV and VinhK = −85 mV; slow oscillatory activity increases to 0.3 Hz with a firing frequency during UP states of 23 Hz and 24 Hz (left and right panel).
Figure 2
Figure 2
Different patterns of network activity given by different Na+-dependent K+ conductances gKNa. Left column, excitatory synaptic connections depressed (fAMPA,NMDAD = 0.9); right column, excitatory and inhibitory synaptic connections depressed (fAMPA,NMDA,GABAAD = 0.9). Inset figures show the last 5 s of each simulation, respectively. From top to bottom, low activity to high activity with firing frequencies during UP states for the left (right) panel of 0(0) Hz, 12(11) Hz, 17(18) Hz and 30(30) Hz, respectively.
Figure 3
Figure 3
Modulation of synaptic depression by network activity. Normalized EPSPs amplitudes evoked by regular current injection. (A) Three different levels of activity by changing the K+ reversal potential: silent network (red line), regular network activity (pink line), and more active network (blue line); and, (B) seven different levels of activity by changing the gKNa conductance from E-I (1.83 mS/cm2) to E-VII (0.26 mS/cm2) (reference line colors at the bottom of the figure). Panels a, b, c represent the normalized PSPs amplitudes when only excitatory synaptic connections were depressed, and panels d, e, f when excitatory and inhibitory connections were depressed at the stimulation frequencies of 5, 10, and 20 Hz, respectively. Lines were plotted using cubic splines. At all the stimulation frequencies there is less STD while the network is active than with low or none activity. Average standard error: 2.0% at 5 Hz, 1.5% at 10 Hz, and 0.9% at 20 Hz.
Figure 4
Figure 4
Input/Output relationships during UP versus DOWN states. Normalized PSPs amplitude during an UP state (pink line) or during a DOWN state (blue line). (A) Network with only excitatory neurons depressed and (B) Network with all connections (excitatory and inhibitory) depressed. An average of 165 trains of 5 spikes at 50 Hz during a DOWN state and 55 trains during an UP state shows that, for all the five spikes in the train, the normalized evoked PSP amplitude is higher during an UP state than during a DOWN state (average standard error = 5.1%(8.2%) during a DOWN state for A and B, respectively, and 6.9%(8.7%) during an UP state for A and B, respectively). (C) Proportion between the average of amplitudes of the EPSPs during DOWN state compared with the average of amplitudes of the PSPs during UP state. Blue line: network with only excitatory synaptic depression; pink line: network with synaptic depression in all connections.
Figure 5
Figure 5
Network activity modified by the amount of short-term synaptic depression in the excitatory connections (each row represents a different level of STD). Each row represents a level of depression, from no depression (A) to the highest depression factor we have tested (F). Left column represents a 20 s simulation for each depression value; middle column, last 5 s of each of the corresponding simulations. Last column, histogram for the me it takes for all neurons to fire the first spike at the beginning of an UP state (randomly chosen). Increasing synaptic depression increases the duration of the UP states while decreasing the duration of the DOWN states. At some level of synaptic depression, between 0.75 ≤ fD ≤ 0.85 (from row D to row E), the network activity changes drastically from an alternating UP state / DOWN state regime to a non-oscillatory regime. The time it takes for all neurons to fire one spike is faster during this last regime.
Figure 6
Figure 6
Firing rate and propagation of UP states in the model network. (A) Rate of wave propagation in the network is basically maintained during the UP/DOWN states regime; this rate is increased when the network activity changes into a continuous firing regime. We found no difference between a network with only excitatory connections depressed (blue line) and a network with both excitatory and inhibitory connections depressed (pink line). The arrow marks the transition point from the oscillatory regime to the continuous firing regime. (B) Intra-up-state rate (y-axis) for each depression factor (x-axis). (C) Both indices (Idist, middle panel, and Iconnect, bottom panel at the left) show that for values of the depression factor (x-axis) greater than fD = 0.75, the wave propagation speed (y-axis) is more or less maintained at the same level, after which the network passes through some kind of bifurcation and starts increasing its wave propagation speed. Since there are no waves during non-oscillatory regime, the index values are no longer useful. (D) Raster plots for two depression factors (middle and bottom panels at the right): at fD = 0.77 the network activity presents UP and DOWN states while at fD = 0.76 the network is at a non-oscillatory regime.
Figure 7
Figure 7
Currents responsible for the duration of an UP state. (A) IKNa current and (B) IKCa current, for four different values of the depression factor fD (figure shows the case where only excitatory synaptic connections are depressed). IKNa current increases slower while IKCa decreases slower during burst as a function of the level of synaptic depression, which tends to lengthen the duration of UP states.
Figure 8
Figure 8
Currents' dissection during UP states. For three significant depression levels: (A) raster plot during the first 10 seconds; (B) sum of currents of an excitatory cell (only somatic compartment shown, in red) and an inhibitory cell (in blue) during an UP state; (C) zoom of (B) in a 500 ms-window; (D,E) sodium-activated and calcium-activated adaptation K+-currents, IKNa and IKCa respectively, in a chosen excitatory cell during an UP state.

References

    1. Azouz R., Gray C. (1999). Cellular mechanisms contributing to response variability of cortical neurons in vivo. J. Neurosci. 19, 2209–2223 - PMC - PubMed
    1. Bazhenov M., Timofeev I., Steriade M., Sejnowski T. (2002). Model of thalamocortical slow wave sleep oscillations and transitions to activated states. J. Neurosci. 22, 8691–8704 - PMC - PubMed
    1. Borst J. G. G. (2010). The low synaptic release probability in vivo. Trends Neurosci. 33, 259–266 10.1016/j.tins.2010.03.003 - DOI - PubMed
    1. Boudreau C., Ferster D. (2005). Short-term depression in thalamocortical synapses of cat primary visual cortex. J. Neurosci. 25, 7179–7190 10.1523/JNEUROSCI.1445-05.2005 - DOI - PMC - PubMed
    1. Bressloff P. C. (1999). Mean-field theory of globally coupled integrate-and-fire neural oscillators with dynamic synapses. Phys. Rev. E 60, 2160–2170 - PubMed