. 2012 Sep 11:3:176.
doi: 10.3389/fgene.2012.00176. eCollection 2012.

Bayesian methods for multivariate modeling of pleiotropic SNP associations and genetic risk prediction

Affiliations

Bayesian methods for multivariate modeling of pleiotropic SNP associations and genetic risk prediction

Stephen W Hartley et al. Front Genet. .

Abstract

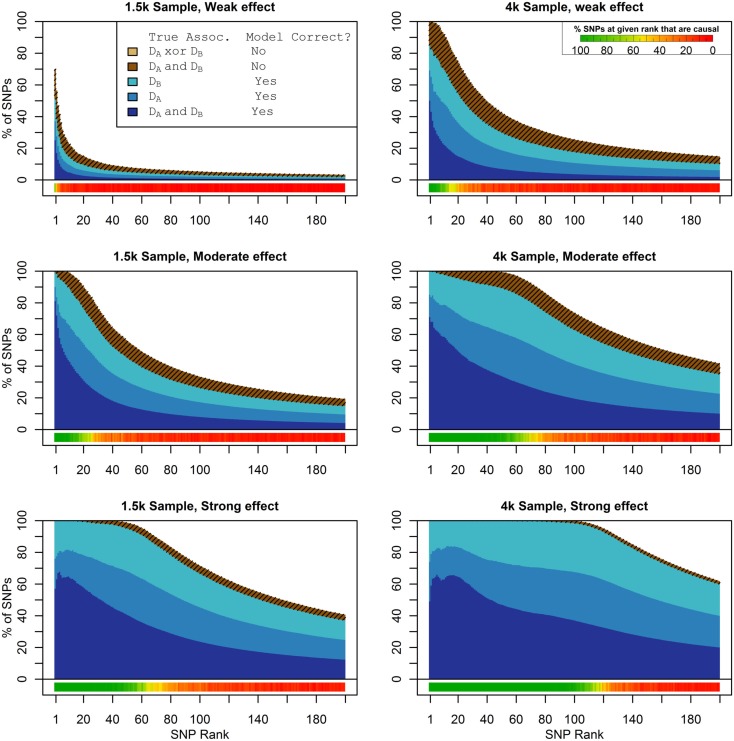
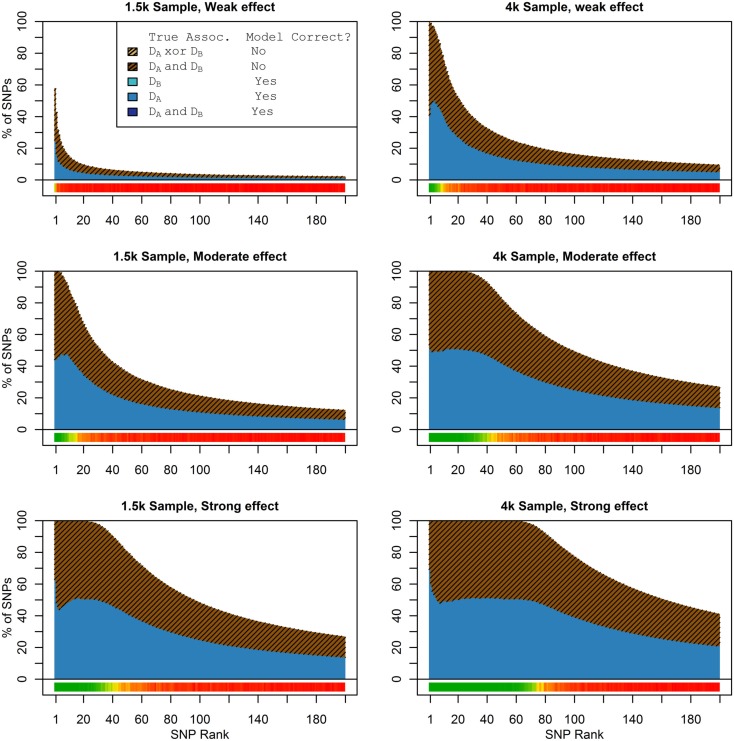
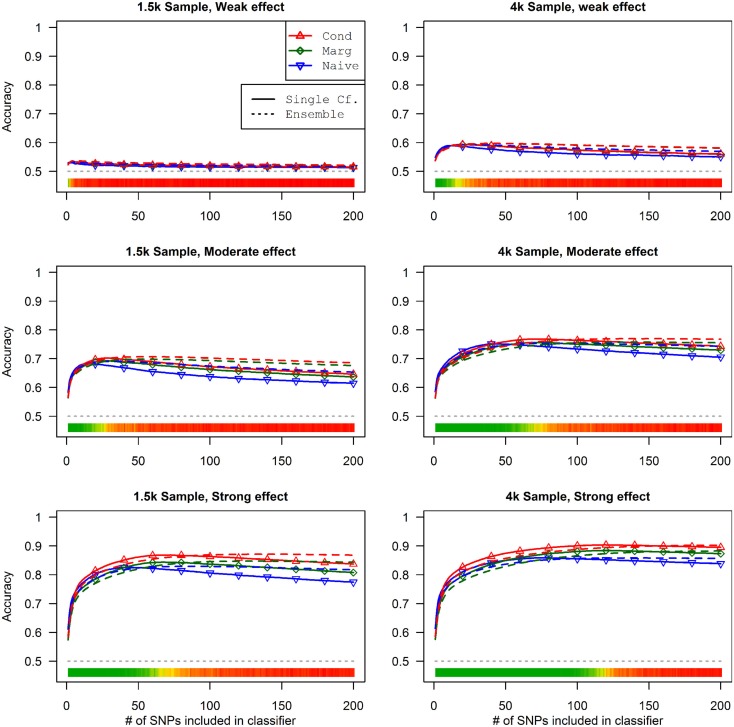
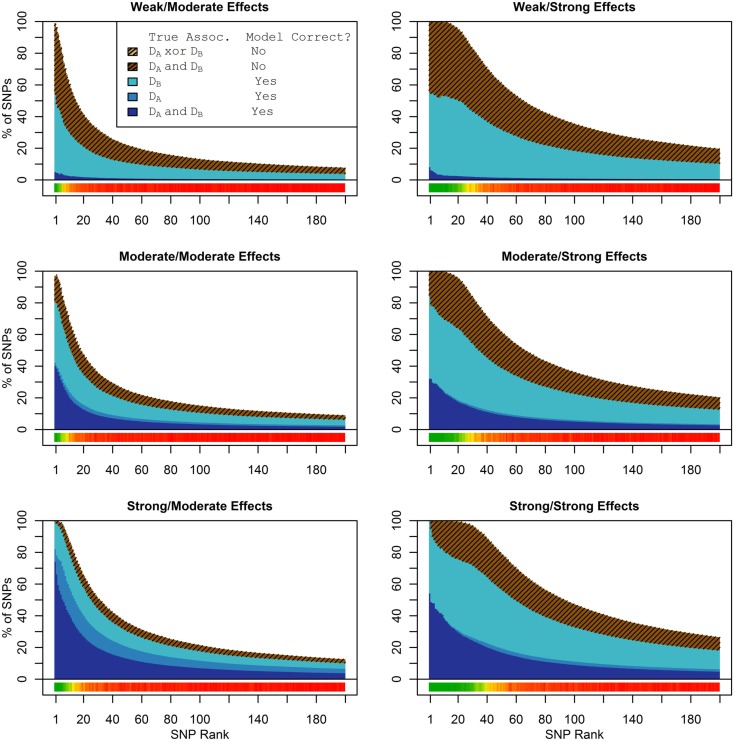
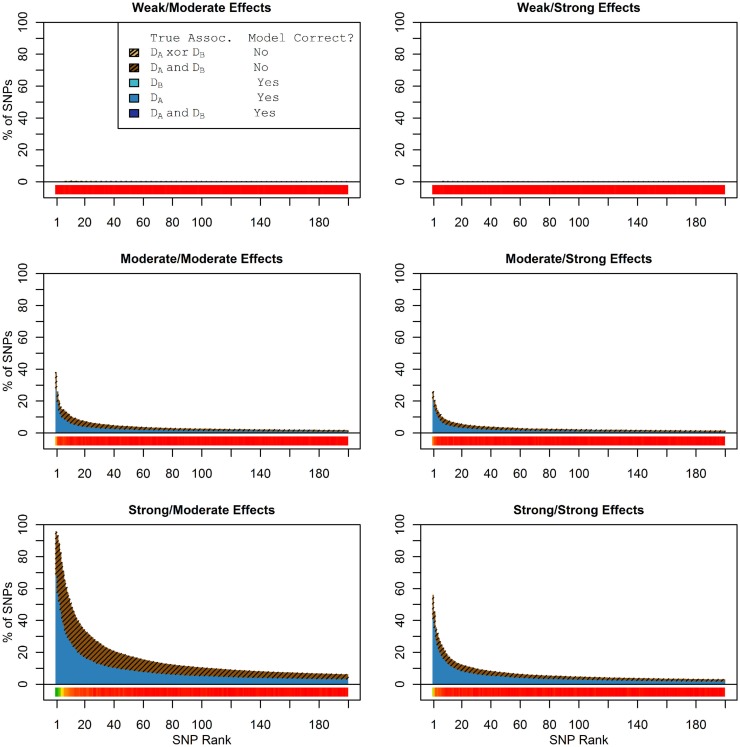
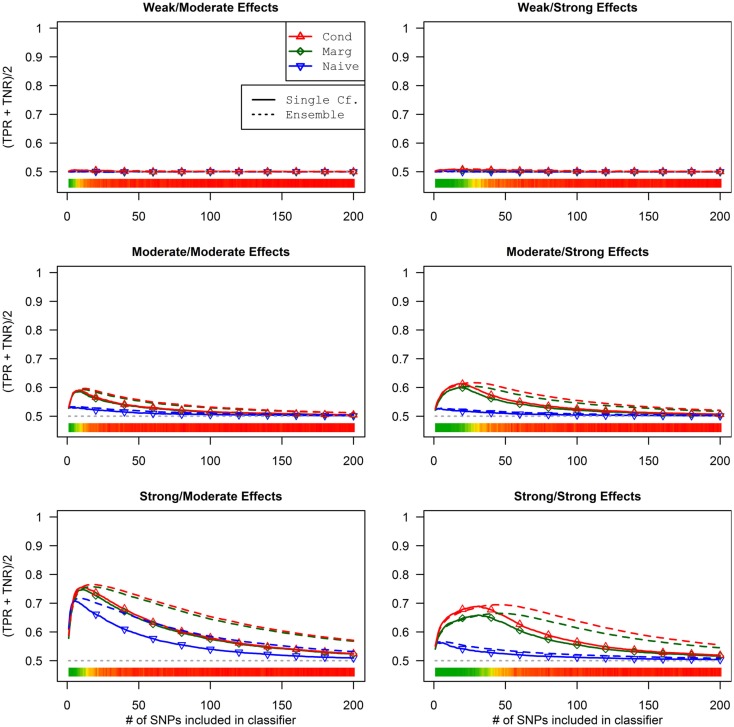
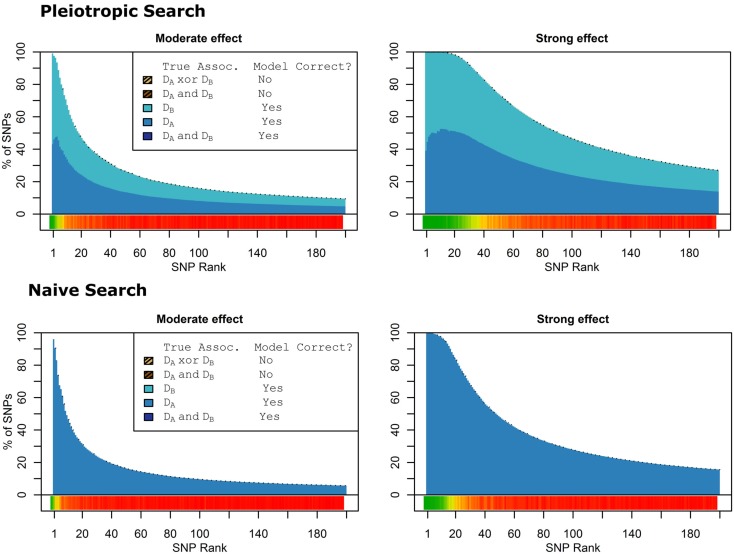
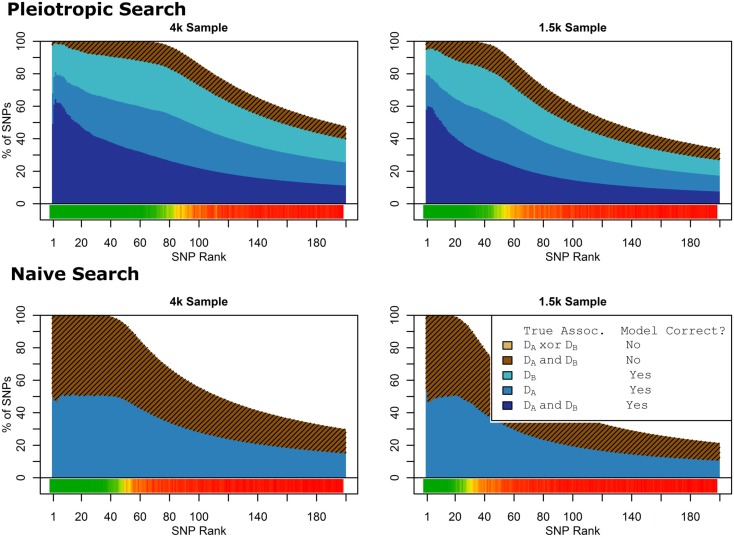
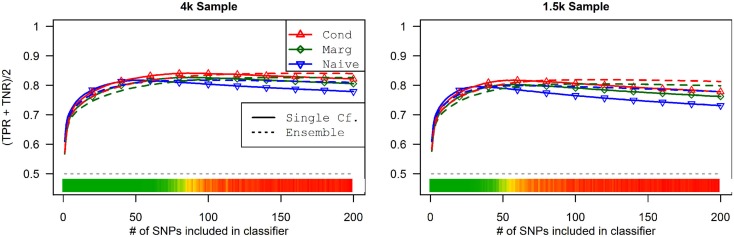
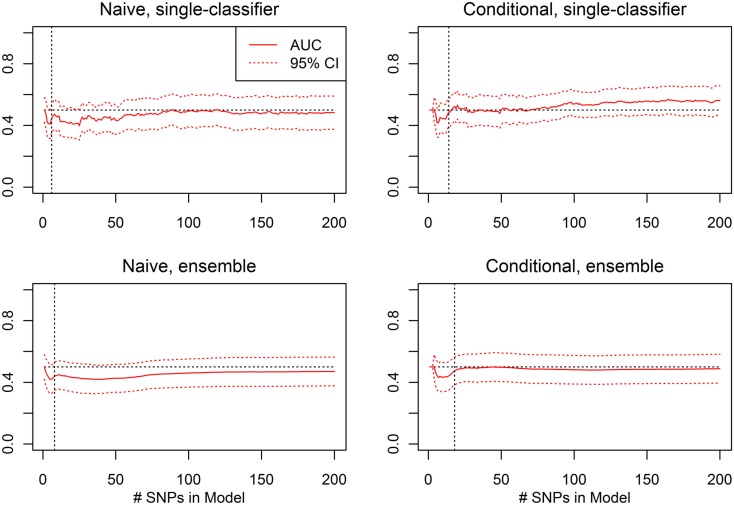
Genome-wide association studies (GWAS) have identified numerous associations between genetic loci and individual phenotypes; however, relatively few GWAS have attempted to detect pleiotropic associations, in which loci are simultaneously associated with multiple distinct phenotypes. We show that pleiotropic associations can be directly modeled via the construction of simple Bayesian networks, and that these models can be applied to produce single or ensembles of Bayesian classifiers that leverage pleiotropy to improve genetic risk prediction. The proposed method includes two phases: (1) Bayesian model comparison, to identify Single-Nucleotide Polymorphisms (SNPs) associated with one or more traits; and (2) cross-validation feature selection, in which a final set of SNPs is selected to optimize prediction. To demonstrate the capabilities and limitations of the method, a total of 1600 case-control GWAS datasets with two dichotomous phenotypes were simulated under 16 scenarios, varying the association strengths of causal SNPs, the size of the discovery sets, the balance between cases and controls, and the number of pleiotropic causal SNPs. Across the 16 scenarios, prediction accuracy varied from 90 to 50%. In the 14 scenarios that included pleiotropically associated SNPs, the pleiotropic model search and prediction methods consistently outperformed the naive model search and prediction. In the two scenarios in which there were no true pleiotropic SNPs, the differences between the pleiotropic and naive model searches were minimal. To further evaluate the method on real data, a discovery set of 1071 sickle cell disease (SCD) patients was used to search for pleiotropic associations between cerebral vascular accidents and fetal hemoglobin level. Classification was performed on a smaller validation set of 352 SCD patients, and showed that the inclusion of pleiotropic SNPs may slightly improve prediction, although the difference was not statistically significant. The proposed method is robust, computationally efficient, and provides a powerful new approach for detecting and modeling pleiotropic disease loci.

Keywords: Bayesian; GWAS; SNP; pleiotropy; prediction.


Figures

Figure 1
Figure 1
Nested model composition, 2-phenotype search (Simulation Set 1). The six graphs depict, for each of the six scenarios, the composition of the models resulting from the 2-phenotype phase I model search (y-axis), as a function of SNP rank cutoff (x-axis). The three blue, un-shaded colors indicate the percentage of the SNPs in the given models that were both causal and assigned to the correct association models. The dark blue indicates pleiotropic SNPs, the medium blue indicates Da-associated SNPs, and the light blue indicates Db-associated SNPs. The brown colors (with diagonal shading lines) indicate SNPs that are causal, but were assigned the incorrect model. Dark brown indicates pleiotropic SNPs that were incorrectly assigned a single-phenotype model. Tan (with diagonal shading lines) would indicate single-phenotype-associated SNPs that were incorrectly assigned either the pleiotropic model or a model with the wrong SNP, but this happened so infrequently that no visible tan pixels are visible. The remaining white space indicates non-causal SNPs erroneously included in the nested models. For example, in the “4k sample, moderate effect” scenario (mid-right plot), the 80-SNP model contains approximately 30% pleiotropic SNPs, 25% SNPs associated with Da and Db each, and around 10% pleiotropic SNPs mistakenly assigned a single-SNP associated model, and around 10% non-causal SNPs (white space). Beneath each graph is a color bar summarizing the percentage of causal SNPs discovered at each rank (see key, inset).
Figure 2
Figure 2
Nested model composition, single-phenotype (naive) search (Simulation Set 1). As Figure 1, except for the single-phenotype (naive) model search, in which Db is entirely withheld from the model selection process. Note that since no pleiotropic models were fitted, all pleiotropic SNPs that were discovered were of course incorrectly modeled with the single-phenotype model. Furthermore, all correctly modeled SNPs were always associated with Da only.
Figure 3
Figure 3
Accuracy of single-classifier and ensemble prediction of Da using three types of classification, by SNP rank cutoff (Simulation Set 1). For each of the six scenarios, the accuracy of single-classifier (solid lines) and ensemble-of-classifier (dashed lines) prediction of Da, using three prediction methods: conditional prediction, in which Da is predicted given known Db (red, upward triangles); marginal, in which Da is predicted without known Db (green, diamonds); and the single-phenotype prediction, in which model search and classification accounts only for Da (blue, downward triangles).
Figure 4
Figure 4
Set 2  Total model composition by rank, 2-phenotype model search (Simulation Set 2). See legend for Figure 1.
Figure 5
Figure 5
Nested model composition by rank, single-phenotype model search (Simulation Set 2). See legend for Figures 1 and 2.
Figure 6
Figure 6
Single-classifier and ensemble-of-classifier Da prediction using three prediction methods, with both single-classifier and ensembles, by SNP set size (Simulation Set 2). See legend for Figure 3. Due to the uneven distribution of Da, total accuracy is not a useful measure of prediction. Therefore, the average of the true positive rate (sensitivity) and true negative rate (specificity) was used. Note that this is a simple linear transformation of the Youden’s J statistic, used to make it comparable to the simple accuracy statistic used in simulation set 2.
Figure 7
Figure 7
Nested model composition by SNP set, pleiotropic, and naive model searches (Simulation Set 3). Legend as in Figures 1 and 2.
Figure 8
Figure 8
Accuracy by prediction method and number of SNPs used, by prediction method (Simulation Set 3). Legend as in Figure 3.
Figure 9
Figure 9
Model composition by SNP set, pleiotropic, and naive model searches (Simulation Set 4). Legend as in Figures 1 and 2.
Figure 10
Figure 10
External validation AUC of the ROC curve, with 95% CI (Simulation Set 4). Legend as in Figure 3.
Figure 11
Figure 11
External validation AUC of the ROC curve, with 95% CI (Real Data Set). Validation set AUC, with Delong 95% confidence intervals, using the classification statistics calculated from each of the nested SNP sets Σ1, …, Σr, for each of four prediction methods: naive single-classifier, naive ensemble, conditional single-classifier, and conditional ensemble.

Similar articles

Cited by

References

    1. Balding D. J. (2006). A tutorial on statistical methods for population association studies. Nat. Rev. Genet. 7, 781–79110.1038/nrg1916 - DOI - PubMed
    1. Chavali S., Barrenas F., Kanduri K., Benson M. (2010). Network properties of human disease genes with pleiotropic effects. BMC Syst. Biol. 4, 78.10.1186/1752-0509-4-78 - DOI - PMC - PubMed
    1. Gupta M., Cheung C. L., Hsu Y. H., Demissie S., Cupples L. A., Kiel D. P., Karasik D. (2011). Identification of homogenous genetic architecture of multiple genetically correlated traits by block clustering of genome-wide associations. J. Bone Miner. Res. 26, 1261–127110.1002/jbmr.333 - DOI - PMC - PubMed
    1. Hand D. J. (2009). “Naive Bayes,” in The Top Ten Algorithms in Data Mining, eds Wu X., Kumar V. (London: Chapman and Hall; ), 163–178
    1. Huang J., Johnson A. D., O’Donnell C. J. (2011). PRIMe: a method for characterization and evaluation of pleiotropic regions from multiple genome-wide association studies. Bioinformatics 27, 1201–120610.1093/bioinformatics/btr557 - DOI - PMC - PubMed

LinkOut - more resources