

doi: 10.1534/g3.112.003202.
Epub 2012 Sep 1.
oPOSSUM-3: advanced analysis of regulatory motif over-representation across genes or ChIP-Seq datasets
Affiliations
- PMID: 22973536
- PMCID: PMC3429929
- DOI: 10.1534/g3.112.003202
Item in Clipboard
oPOSSUM-3: advanced analysis of regulatory motif over-representation across genes or ChIP-Seq datasets
G3 (Bethesda).
2012 Sep.
Abstract
oPOSSUM-3 is a web-accessible software system for identification of over-represented transcription factor binding sites (TFBS) and TFBS families in either DNA sequences of co-expressed genes or sequences generated from high-throughput methods, such as ChIP-Seq. Validation of the system with known sets of co-regulated genes and published ChIP-Seq data demonstrates the capacity for oPOSSUM-3 to identify mediating transcription factors (TF) for co-regulated genes or co-recovered sequences. oPOSSUM-3 is available at http://opossum.cisreg.ca.
Keywords: ChIP-Seq; gene regulation; transcription; transcription factor binding sites (TFBS).
Figures
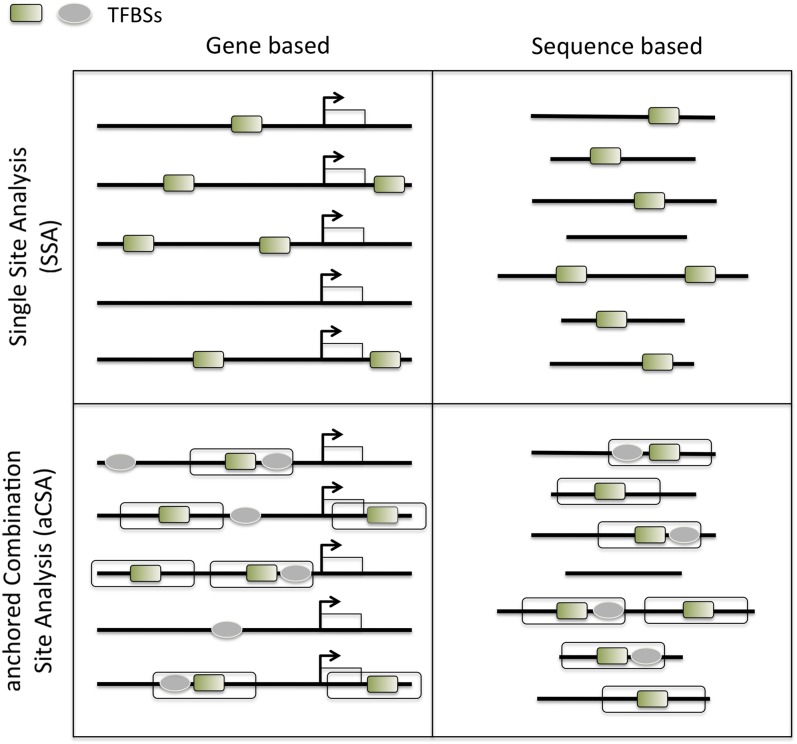
Overview of the main analysis types available in oPOSSUM-3. The input for oPOSSUM can be either gene-based, which makes use of pre-computed results based on annotated genomic information, or sequenced-based, in which the user supplies the input sequences (e.g. ChIP-Seq results) for analysis. There are four methods available: (1) Single Site Analysis (SSA), (2) TFBS Cluster Analysis (TCA), (3) anchored Combination Site Analysis (aCSA), and (4) anchored TFBS Cluster Analysis (aCTCA). The first two methods apply enrichment analyses to individual TFs or TFBS clusters, whereas the latter two methods apply enrichment analyses to pairs of individual TFs or pairs of TFBS clusters. SSA and aCSA are depicted in this figure.
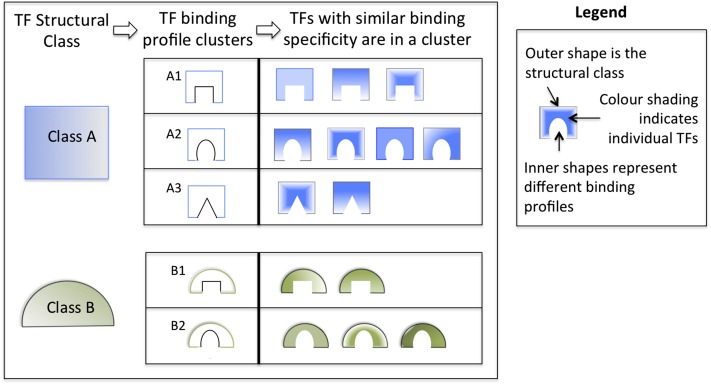
TF structural families and TFBS clusters. As many TFs cannot be distinguished in their binding specificity, clustering TF binding profiles promotes user consideration of all members of a functionally equivalent group. As TFs within a group bind to essentially identical sequences, users should focus on those TFs within a group likely to be active in a cell or condition relevant to their research. In the figure, the outer shapes and color represent the structural class, and the inner shapes symbolize the binding specificity of a cluster. The different shading within the shapes denotes individual TFs.
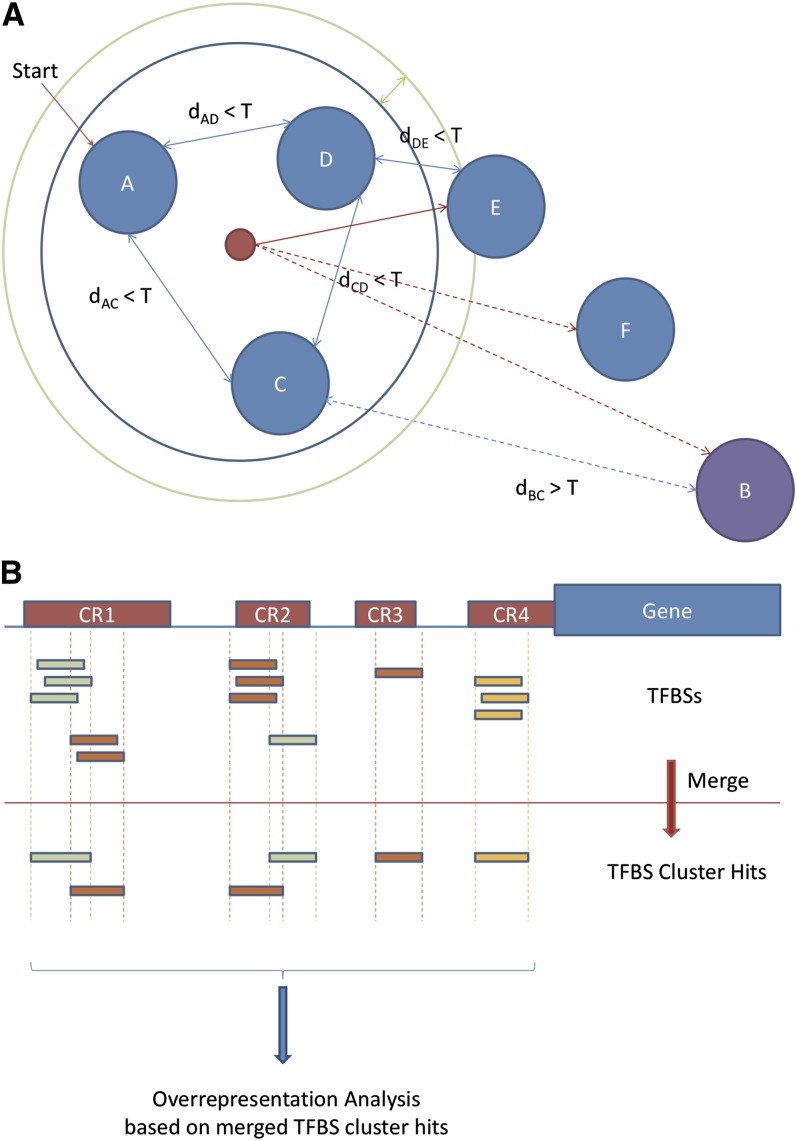
TFBS cluster analysis. (A) TFBS clustering process. Binding site profiles (represented by solid blue circles) are compared, and those exhibiting similarity (all pairwise similarity scores within a threshold T) are classified as a group (placed within the blue ring). In a second step, a consensus of the initial set is generated, and all additional profiles within the radius margin threshold (represented by the green ring) are added to the group. (B) Individual TFBS hits within a DNA sequence are grouped together according to the clustered groups, and over-representation analysis is performed from the group perspective. Each labeled red rectangle (e.g., CR1) represents a cluster of TFBSs (individually displayed as small rectangles below).
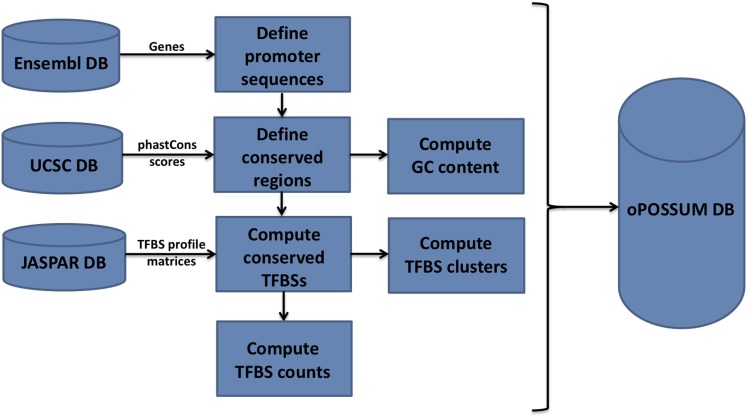
The build process for oPOSSUM 3 gene-based analysis. The system incorporates data from the gene annotation data from Ensembl, TFBS profiles from JASPAR, and multi-species conservation information based on phastCons scores from UCSC Genome Browser. The oPOSSUM database incorporates the data from these sources to pre-compute TFBS profile hits for gene-based analysis.
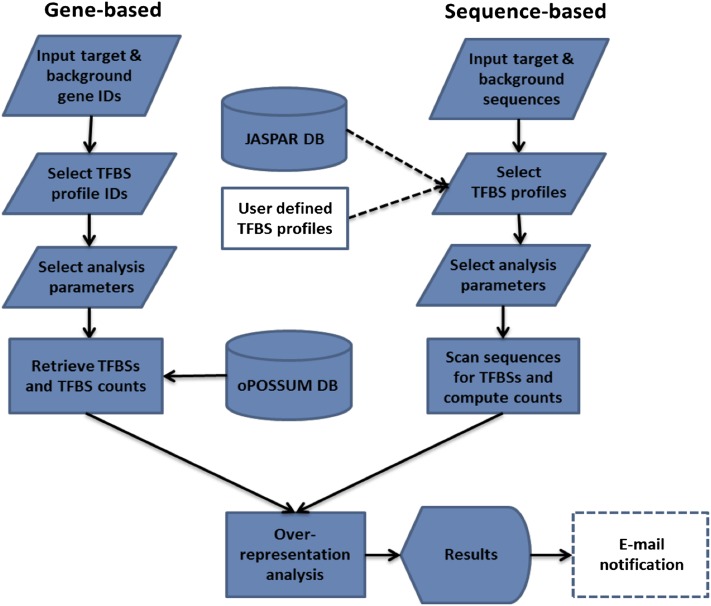
oPOSSUM analysis pipeline. Dashed lines indicate optional stages.
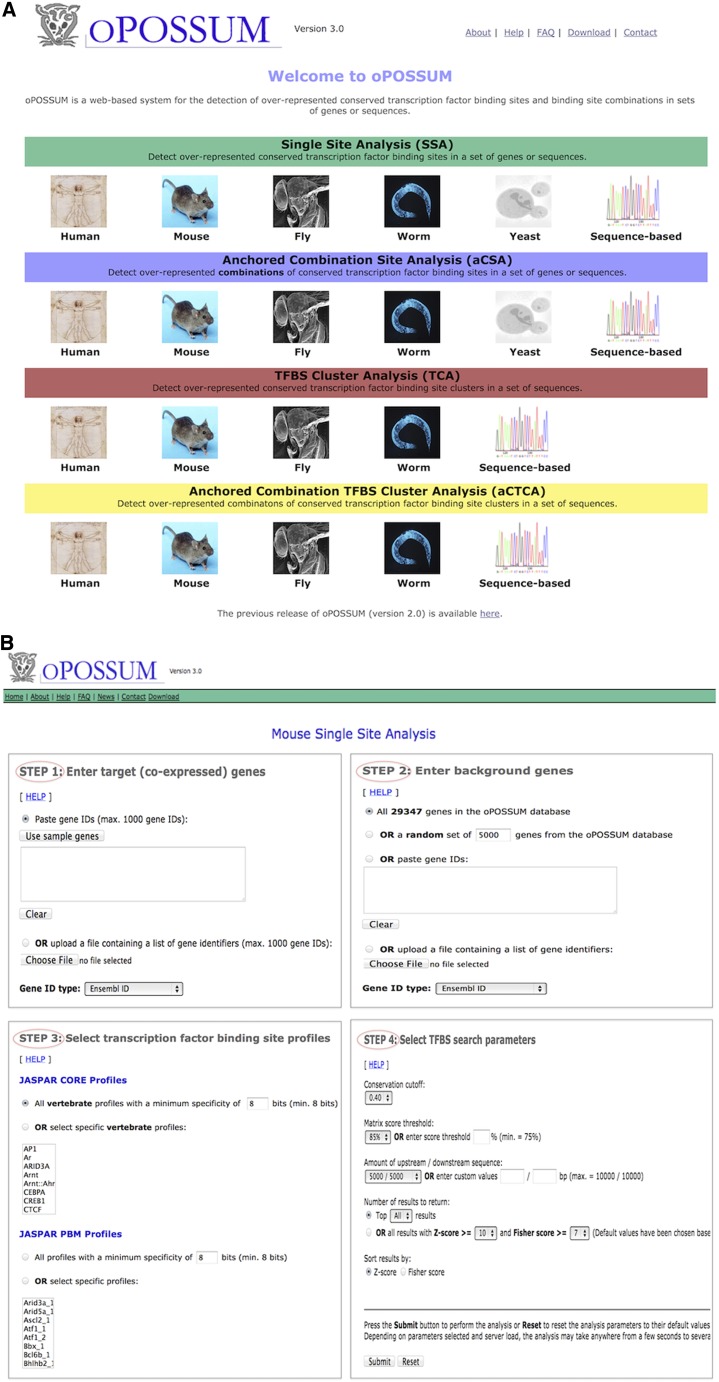
Web interface. (A) oPOSSUM home page listing the various analyses and organisms available. (B) Four steps for initiating a Single Site Analysis (SSA) with user-chosen parameters.
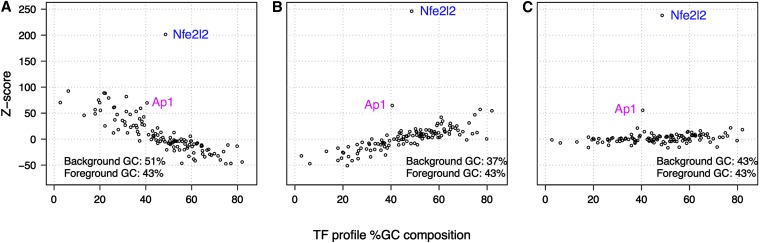
Relationship between TF profile GC content and enrichment statistics. The percentage of G and C nucleotides in the TF profile models are plotted against the motif enrichment Z-scores. The three panels represent analysis results for the same 1256 Nfe2L2 ChIP-Seq regions (GC composition avg. 43%) compared with three background sets of different GC composition: (A) elevated background GC (avg. 51% GC); (B) low background GC (avg. 37% GC); and (C) background with GC composition matched to the distribution of the ChIP-Seq regions (avg. 43% GC). The GC composition of the background used in B is that of the control associated with the Nfe2L2 ChIP-Seq data. The plotted Z-scores represent the enrichment of TFs in 1256 ChIP-Seq Nfe2L2-bound regions. The Nfe2L2 profile can be distinguished in all three cases (A, B, and C). However, detection of the Ap1 profile, representing a TF with a known Nfe2L2-related biological function, is sensitive to background selection. Most TFs that would be ranked highly by Z-score when the background is not corrected for GC composition (seen in A and B) are not ranked highly when the background is matched to the foreground distribution of GC composition (C).
References
-
- Arnold P., Erb I., Pachkov M., Molina N., Van Nimwegen E., 2012. MotEvo: integrated Bayesian probabilistic methods for inferring regulatory sites and motifs on multiple alignments of DNA sequences. Bioinformatics 28: 487–494 - PubMed
-
- Arnone M. I., Davidson E. H., 1997. The hardwiring of development: organization and function of genomic regulatory systems. Development 124: 1851–1864 - PubMed
-
- Benjamini, Y., and Y. Hochberg, 1995 Controlling the false discovery rate: a practical and powerful approach to multiple testing. J. R. Stat. Soc. B 57: 289–300.
Publication types
MeSH terms
Substances
Grants and funding
LinkOut - more resources
Full Text Sources
Miscellaneous