. 2012 Sep;2(9):1067-75.
doi: 10.1534/g3.112.002618. Epub 2012 Sep 1.

Uncovering networks from genome-wide association studies via circular genomic permutation

Affiliations

Uncovering networks from genome-wide association studies via circular genomic permutation

Claudia P Cabrera et al. G3 (Bethesda). 2012 Sep.

Abstract

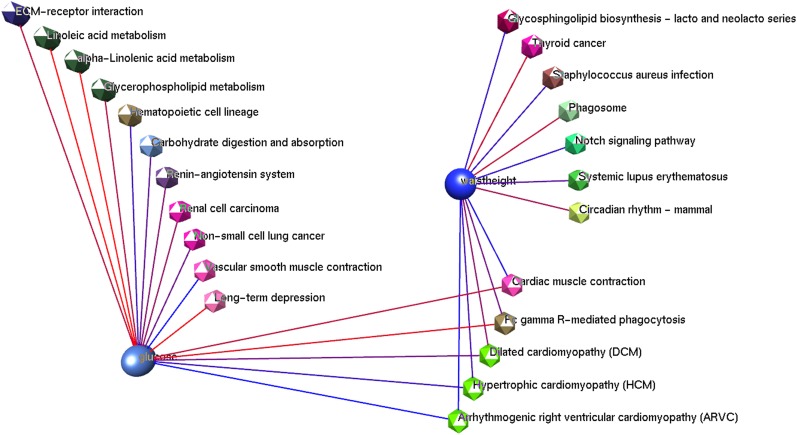
Genome-wide association studies (GWAS) aim to detect single nucleotide polymorphisms (SNP) associated with trait variation. However, due to the large number of tests, standard analysis techniques impose highly stringent significance thresholds, leaving potentially associated SNPs undetected, and much of the trait genetic variation unexplained. Pathway- and network-based methodologies applied to GWAS aim to detect associations missed by standard single-marker approaches. The complex and non-random architecture of the genome makes it a challenge to derive an appropriate testing framework for such methodologies. We developed a rapid and simple permutation approach that uses GWAS SNP association results to establish the significance of pathway associations while accounting for the linkage disequilibrium structure of SNPs and the clustering of functionally related elements in the genome. All SNPs used in the GWAS are placed in a "circular genome" according to their location. Then the complete set of SNP association P values are permuted by rotation with respect to the genomic locations of the SNPs. Once these "simulated" P values are assigned, the joint gene P values are calculated using Fisher's combination test, and the association of pathways is tested using the hypergeometric test. The circular genomic permutation approach was applied to a human genome-wide association dataset. The data consists of 719 individuals from the ORCADES study genotyped for ~300,000 SNPs and measured for 51 traits ranging from physical to biochemical measurements. KEGG pathways (n = 225) were used as the sets of pathways to be tested. Our results demonstrate that the circular genomic permutations provide robust association P values. The non-permuted hypergeometric analysis generates ~1400 pathway-trait combination results with an association P value more significant than P ≤ 0.05, whereas applying circular genomic permutation reduces the number of significant results to a more credible 40% of that value. The circular permutation software ("genomicper") is available as an R package at http://cran.r-project.org/.

Keywords: GWAS; cardiac disease; genomicper R package; pathway-based; permutation method.


Figures

Figure 1
Figure 1
Threshold distributions at distances 0 and 20 kb. Distance 0: The first quartile of the tests sets a threshold of ∼0.02 and the third quartile is set at ∼0.03, whereas the maximum value was equal to 0.175. The range of threshold distributions at 20 kb was smaller than that observed at distance 0. The first quartile had a threshold of ∼ 0.008, the third only went up to ∼0.02, and the maximum threshold set was 0.093.
Figure 2
Figure 2
Hypergeometric-theoretical P values vs. hypergeometric-empirical P values at distances 0 and 20 kb. Visual representation of the relationship of the hypergeometric-theoretical P values (x-axis) compared with the hypergeometric-empirical P values from the permutations (y-axis). To assess the effect of the size of the pathways (i.e., number of genes in the pathway), P values are colored by pathway size. For this representation, pathways were clustered using k-means with eight groups. The legend represents the centers of that size group. (Top plots) The red line represents the trend that would be followed if the hypergeometric-empirical P values would match perfectly to those of the hypergeometric-theoretical P values. (Bottom plots) Close-up from the top plot, where the red lines are fixed at a 0.05 empirical threshold. The close-up graph represents all the tests below an arbitrary threshold set at 0.05 when using the hypergeometric test alone. The results below the line represent the significant results when applying circular permutations; results above the line are those which were not longer significant according to this method.
Figure 3
Figure 3
Permutation distributions. Three pathways and their hypergeometric P value permuted distributions for the glucose trait. Each individual plot represents the outcome of the 10,000 permuted hypergeometric tests per pathway. These three pathways were selected because they represent the three trends observed across all the analyzed pathways. The left column represents the circular genomic permutation P value distribution; the central column represents the SNP-level random permutation P value distribution, and the right column represents the gene-level random permutation P value distribution.
Figure 4
Figure 4
Permutation methods. This plot compares the hypergeometric P values on the x-axis to the permutation P values in the y-axis. The three permutation methodologies are represented (circular genomic permutation, the SNP-level random permutation, and the gene-level random permutations).
Figure 5
Figure 5
Significant tests related to the arrhythmogenic right ventricular cardiomyopathy (ARVC) pathway. Two traits (glucose and waist-to-height ratio) were found to be significant for the ARVC pathway. Both traits share a total of five pathways significant for both traits. Traits are represented by sphere nodes, and pathways are represented by the icosahedron nodes. The pathways are colored according to their pathway category. The link between the pathways and the traits (edges) represent the significant results obtained through the circular genomic permutation approach. Edges are colored from a blue-to-red scale, where blue represents the most significant results (i.e., the ARVC pathway and the trait glucose hypergeometric-empirical P value = 0.0004, whereas the linoleic acid metabolism and glucose hypergeometric-empirical P value = 0.044). Image produced using BioLayout Express (Freeman et al. 2007).

References

    1. Aulchenko Y. S., Ripke S., Isaacs A., van Duijn C. M., 2007. GenABEL: an R library for genome-wide association analysis. Bioinformatics 23: 1294–1296 - PubMed
    1. Ballard D., Abraham C., Cho J., Zhao H., 2010. Pathway analysis comparison using Crohn’s disease genome wide association studies. BMC Med. Genomics 3: 25. - PMC - PubMed
    1. Baranzini S. E., Galwey N. W., Wang J., Khankhanian P., Lindberg R., et al. , 2009. Pathway and network-based analysis of genome-wide association studies in multiple sclerosis. Hum. Mol. Genet. 18: 2078–2090 - PMC - PubMed
    1. Callegaro A., Basso D., Bicciato S., 2006. A locally adaptive statistical procedure (LAP) to identify differentially expressed chromosomal regions. Bioinformatics 22: 2658–2666 - PubMed
    1. Caron H., Schaik B. v., Mee M. d., Baas F., Riggins G., et al. , 2001. The human transcriptome map: clustering of highly expressed genes in chromosomal domains. Science 291: 1289–1292 - PubMed

Publication types

LinkOut - more resources