

Influenza virus-membrane fusion triggered by proton uncaging for single particle studies of fusion kinetics
- PMID: 22974237
- PMCID: PMC3489278
- DOI: 10.1021/ac3006473
Influenza virus-membrane fusion triggered by proton uncaging for single particle studies of fusion kinetics
Abstract
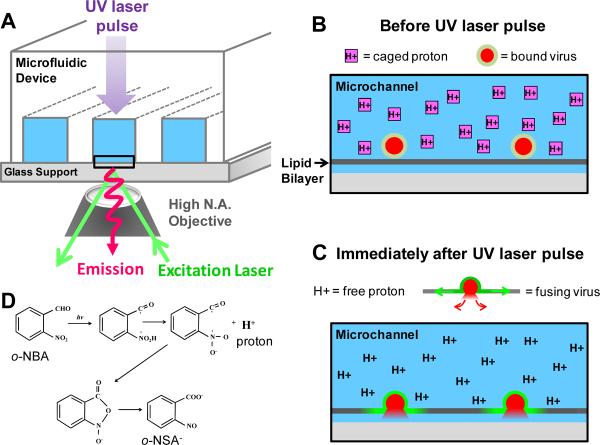
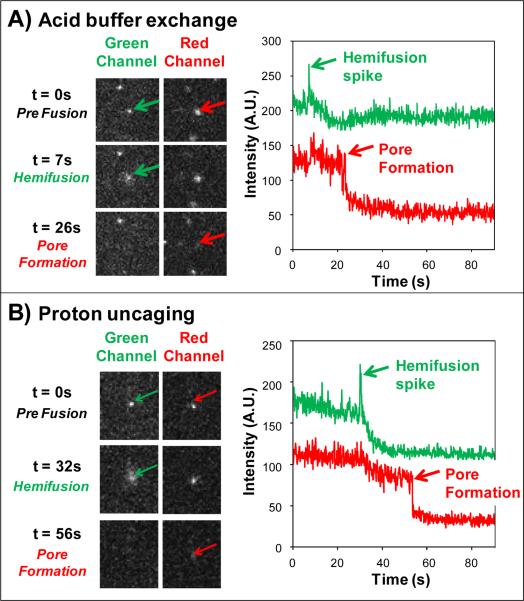
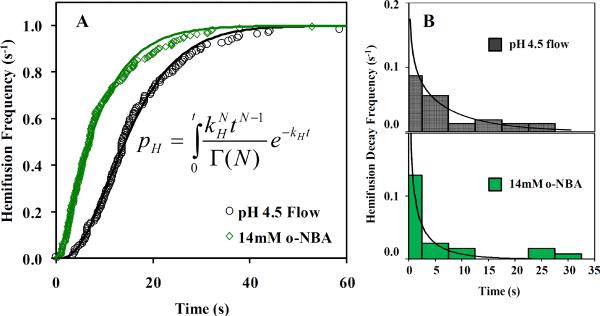
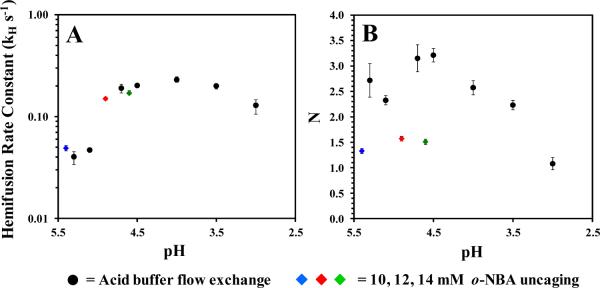
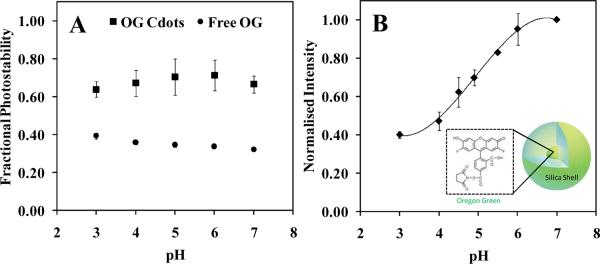
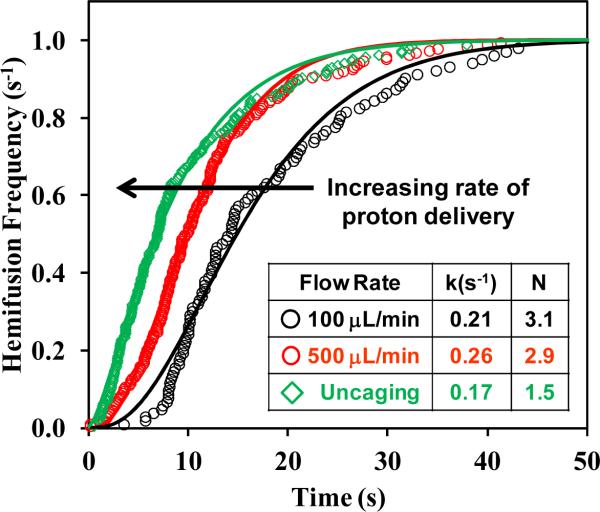
We report a method for studying membrane fusion, focusing on influenza virus fusion to lipid bilayers, which provides high temporal resolution through the rapid and coordinated initiation of individual virus fusion events. Each fusion event proceeds through a series of steps, much like multistep chemical reaction. Fusion is initiated by a rapid decrease in pH that accompanies the "uncaging" of an effector molecule from o-nitrobenzaldehyde, a photoisomerizable compound that releases a proton to the surrounding solution within microseconds of long-wave ultraviolet irradiation. In order to quantify pH values upon UV irradiation and uncaging, we introduce a simple silica nanoparticle pH sensor, useful for reporting the pH in homogeneous nanoliter volumes under conditions where traditional organic dye-type pH probes fail. Subsequent single-virion fusion events are monitored using total internal reflection fluorescence microscopy. Statistical analysis of these stochastic events uncovers kinetic information about the fusion reaction. This approach reveals that the kinetic parameters obtained from the data are sensitive to the rate at which protons are delivered to the bound viruses. Higher resolution measurements can enhance fundamental fusion studies and aid antiviral antifusogenic drug development.
Figures
Similar articles
-
Relating influenza virus membrane fusion kinetics to stoichiometry of neutralizing antibodies at the single-particle level.Proc Natl Acad Sci U S A. 2014 Dec 2;111(48):E5143-8. doi: 10.1073/pnas.1411755111. Epub 2014 Nov 17. Proc Natl Acad Sci U S A. 2014. PMID: 25404330 Free PMC article.
-
Disentangling Viral Membrane Fusion from Receptor Binding Using Synthetic DNA-Lipid Conjugates.Biophys J. 2016 Jul 12;111(1):123-31. doi: 10.1016/j.bpj.2016.05.048. Biophys J. 2016. PMID: 27410740 Free PMC article.
-
Rapid membrane fusion of individual virus particles with supported lipid bilayers.Biophys J. 2007 Jul 15;93(2):526-38. doi: 10.1529/biophysj.106.097485. Epub 2007 Apr 20. Biophys J. 2007. PMID: 17449662 Free PMC article.
-
Physicochemical tools for studying virus interactions with targeted cell membranes in a molecular and spatiotemporally resolved context.Anal Bioanal Chem. 2021 Dec;413(29):7157-7178. doi: 10.1007/s00216-021-03510-5. Epub 2021 Sep 7. Anal Bioanal Chem. 2021. PMID: 34490501 Free PMC article. Review.
-
Visualization of membrane fusion, one particle at a time.Biochemistry. 2013 Mar 12;52(10):1654-68. doi: 10.1021/bi301573w. Epub 2013 Feb 19. Biochemistry. 2013. PMID: 23421412 Review.
Cited by
-
Viral fusion efficacy of specific H3N2 influenza virus reassortant combinations at single-particle level.Sci Rep. 2016 Oct 18;6:35537. doi: 10.1038/srep35537. Sci Rep. 2016. PMID: 27752100 Free PMC article.
-
Single-Particle Tracking Shows that a Point Mutation in the Carnivore Parvovirus Capsid Switches Binding between Host-Specific Transferrin Receptors.J Virol. 2016 Apr 14;90(9):4849-53. doi: 10.1128/JVI.03204-15. Print 2016 May. J Virol. 2016. PMID: 26889026 Free PMC article.
-
Single-virus fusion experiments reveal proton influx into vaccinia virions and hemifusion lag times.Biophys J. 2013 Jul 16;105(2):420-31. doi: 10.1016/j.bpj.2013.06.016. Biophys J. 2013. PMID: 23870263 Free PMC article.
-
Label-Free Detection of Virus-Membrane Interactions Using Surface-Enhanced Infrared Absorption (SEIRA) Spectroscopy.Angew Chem Int Ed Engl. 2025 Jul 28;64(31):e202502998. doi: 10.1002/anie.202502998. Epub 2025 Jun 9. Angew Chem Int Ed Engl. 2025. PMID: 40489072 Free PMC article.
-
Single particle tracking assay to study coronavirus membrane fusion.Methods Mol Biol. 2015;1282:183-94. doi: 10.1007/978-1-4939-2438-7_16. Methods Mol Biol. 2015. PMID: 25720481 Free PMC article.
References
-
- Wilschut J, Hoekstra D, editors. Membrane Fusion. Marcel Dekker, Inc.; New York, NY: 1991.
-
- Skehel JJ, Wiley DC. Annu. Rev. Biochem. 2000;69:531–569. - PubMed
-
- Hoekstra D, de Boer T, Klappe K, Wilschut J. Biochemistry. 1984;23:5675–5681. - PubMed
-
- Hoekstra D, Klappe K. Methods in Enzymology. 1993;220 - PubMed
Publication types
MeSH terms
Substances
Grants and funding
LinkOut - more resources
Full Text Sources
Medical
