. 2012 Sep 14;10(1):27.
doi: 10.1186/1478-811X-10-27.

SRC Homology 2 Domain Binding Sites in Insulin, IGF-1 and FGF receptor mediated signaling networks reveal an extensive potential interactome

Affiliations

SRC Homology 2 Domain Binding Sites in Insulin, IGF-1 and FGF receptor mediated signaling networks reveal an extensive potential interactome

Bernard A Liu et al. Cell Commun Signal. .

Abstract

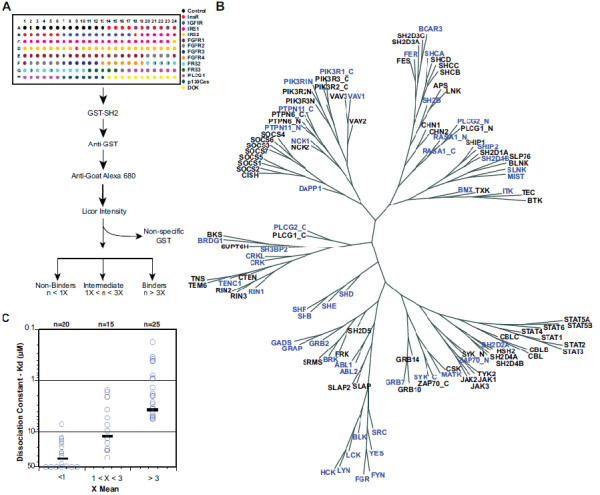
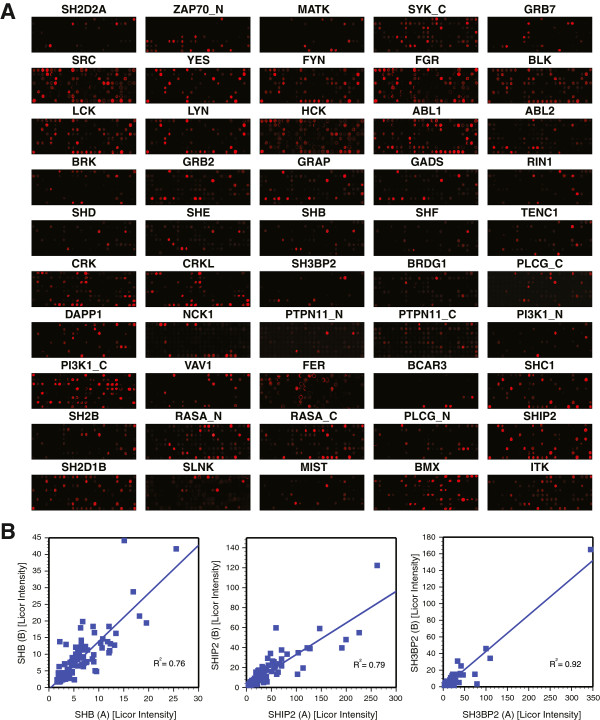
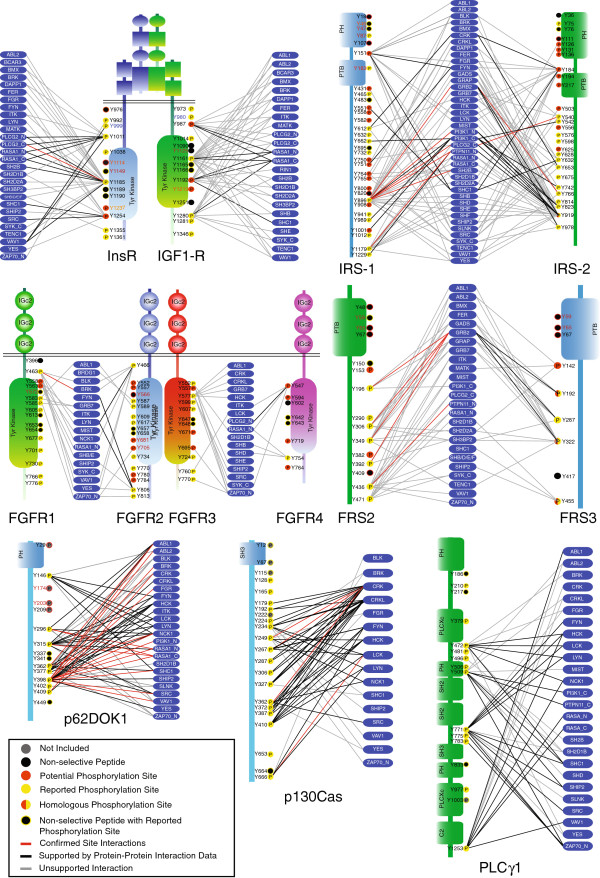
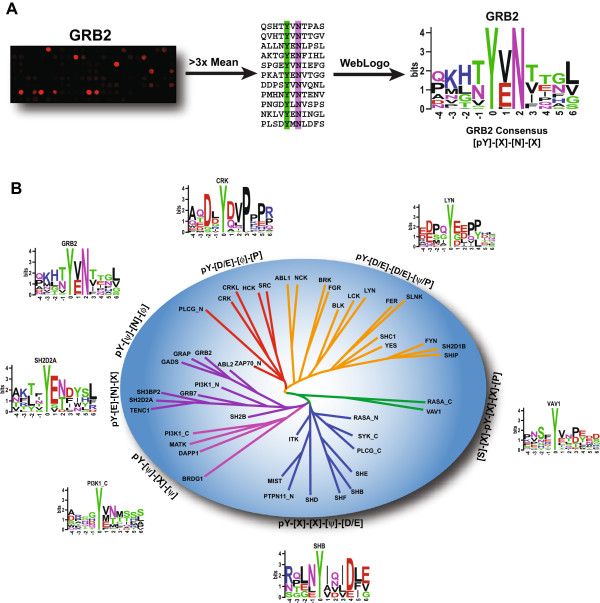
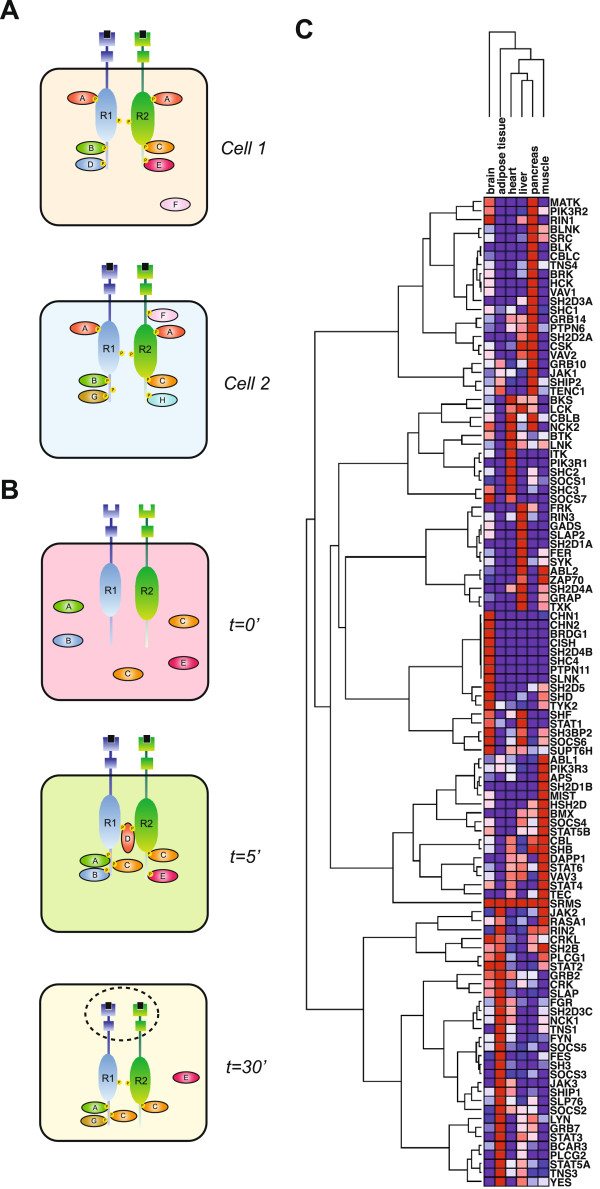
Specific peptide ligand recognition by modular interaction domains is essential for the fidelity of information flow through the signal transduction networks that control cell behavior in response to extrinsic and intrinsic stimuli. Src homology 2 (SH2) domains recognize distinct phosphotyrosine peptide motifs, but the specific sites that are phosphorylated and the complement of available SH2 domains varies considerably in individual cell types. Such differences are the basis for a wide range of available protein interaction microstates from which signaling can evolve in highly divergent ways. This underlying complexity suggests the need to broadly map the signaling potential of systems as a prerequisite for understanding signaling in specific cell types as well as various pathologies that involve signal transduction such as cancer, developmental defects and metabolic disorders. This report describes interactions between SH2 domains and potential binding partners that comprise initial signaling downstream of activated fibroblast growth factor (FGF), insulin (Ins), and insulin-like growth factor-1 (IGF-1) receptors. A panel of 50 SH2 domains screened against a set of 192 phosphotyrosine peptides defines an extensive potential interactome while demonstrating the selectivity of individual SH2 domains. The interactions described confirm virtually all previously reported associations while describing a large set of potential novel interactions that imply additional complexity in the signaling networks initiated from activated receptors. This study of pTyr ligand binding by SH2 domains provides valuable insight into the selectivity that underpins complex signaling networks that are assembled using modular protein interaction domains.


Figures

Figure 1
Figure 1
Probing interactions between SH2 domains and physiological peptide ligands at a systems level. (A) A representation of a SPOT peptide array containing 192 phosphotyrosine peptides including control peptides (black) and peptides from the 13 proteins present on the array indicated by their represented colors. SPOT peptide arrays were incubated with 250nM GST-SH2 domain as indicated. Interactions were detected using anti-GST antisera and Alexa-680-labeled anti-mouse secondary antibody and the intensity of signals recorded using LiCor Odyssey. (B) Neighbor-Joining Tree of all 121 SH2 domains. Highlighted in blue are the 50 SH2 domains selected across different families for this study. (C) Peptide arrays using SPOTS is a semi-quantitative method for measuring protein domain-pTyr peptide interactions. The dissociation constants (KD) were measured between 60 interaction pairs presenting interactions determined using peptide arrays as greater than 3X the mean, between 1 and 3X the mean and less than 3X the mean. The mean KD value for each group is marked with a black line.
Figure 2
Figure 2
Addressable peptide arrays reveal SH2 domain selectivity. (A) 50 SPOT arrays panned against 50 GST-SH2 domains reveals the highly selective nature of SH2 domain phosphopeptide interactions. Interactions were detected using anti-GST antisera and Alexa Fluor-680-labeled anti-goat secondary antibody and the intensity of signals recorded using LiCor Odyssey. (B) Two separate peptide arrays were probed with independent SH2 domain preparations for three SH2 domains (SHB, SHIP2, SH3BP2). The scatter plot reveal some variability between the independent SPOT experiments yet revealing a strong correlation coefficient (R2).
Figure 3
Figure 3
High-resolution interaction maps detail an SH2 domains potential interactome. A phosphotyrosine interactome for 13 proteins involved in FGF-family and Insulin-family signaling and 50 SH2 domain partners. Phosphotyrosine peptides are indicated by their position within their host protein and color-coded as either PhosphoSite reported phosphorylation sites (yellow); sites not reported as phosphorylated (red); sites not reported to be phosphorylated but where a closely related site on a paralogous protein is known to be phosphorylated (red/yellow); or the peptide was discarded as non-specific (black). Interactions between the vertices of SH2 domains and phosphopeptides identified in this study are indicated as edges (lines) and color-coded according to the level of support provided by previous studies: if the precise phosphorylation site has been reported to interact with the noted SH2 domain the edge is denoted in red. A black line is representative of proteins that are reported to interact defined by interaction databases including HPRD, BIND, MINT and DIP, but the site of interaction is unknown. SH2 interactions not confirmed by literature but whose binding is greater than 3X mean on the array are represented with grey lines.
Figure 4
Figure 4
Specificity for physiological peptides defines functional groups of SH2 domains. (A) Grb2 SH2 domain positive peptides are highlighted and then represented as an EDSM logo. See Figure S5 for EDSM logos of all tested SH2 domains. (B) An unrooted dendrogram clusters families of SH2 domains related by similar binding patterns. A distance matrix between EDSMs was computed and used to generate an unrooted distance tree (see Figure S6). This is artistically represented as a dendrogram with general specificity information overlaid and functional classes denoted by branch color.
Figure 5
Figure 5
Tissue co-expression and microstate of the Insulin/IGF-1 system. Protein interaction microstates across different cell types and across time and space. (A) Co-expression between receptors and SH2 domains can influence the microstate of a specific tissue. (B) Phosphorylation of receptors under stimulation conditions can determine the temporal and spatial events of SH2 ligand binding within a cell. (C) Hierarchical clustering of the insulin responsive tissue expression levels for human SH2 domain-containing genes.

Similar articles

Cited by

References

    1. van der Geer P, Hunter T, Lindberg RA. Receptor protein-tyrosine kinases and their signal transduction pathways. Annu Rev Cell Biol. 1994;10:251–337. - PubMed
    1. Fantl WJ, Johnson DE, Williams LT. Signalling by receptor tyrosine kinases. Annu Rev Biochem. 1993;62:453–481. - PubMed
    1. Lemmon MA, Schlessinger J. Cell signaling by receptor tyrosine kinases. Cell. 2010;141:1117–1134. - PMC - PubMed
    1. Yaffe MB. Phosphotyrosine-binding domains in signal transduction. Nat Rev Mol Cell Biol. 2002;3:177–186. - PubMed
    1. Pawson T. Specificity in signal transduction: from phosphotyrosine-SH2 domain interactions to complex cellular systems. Cell. 2004;116:191–203. - PubMed

LinkOut - more resources