

Knockout of SOD1 alters murine hepatic glycolysis, gluconeogenesis, and lipogenesis
- PMID: 22974764
- PMCID: PMC3472123
- DOI: 10.1016/j.freeradbiomed.2012.08.570
Knockout of SOD1 alters murine hepatic glycolysis, gluconeogenesis, and lipogenesis
Abstract
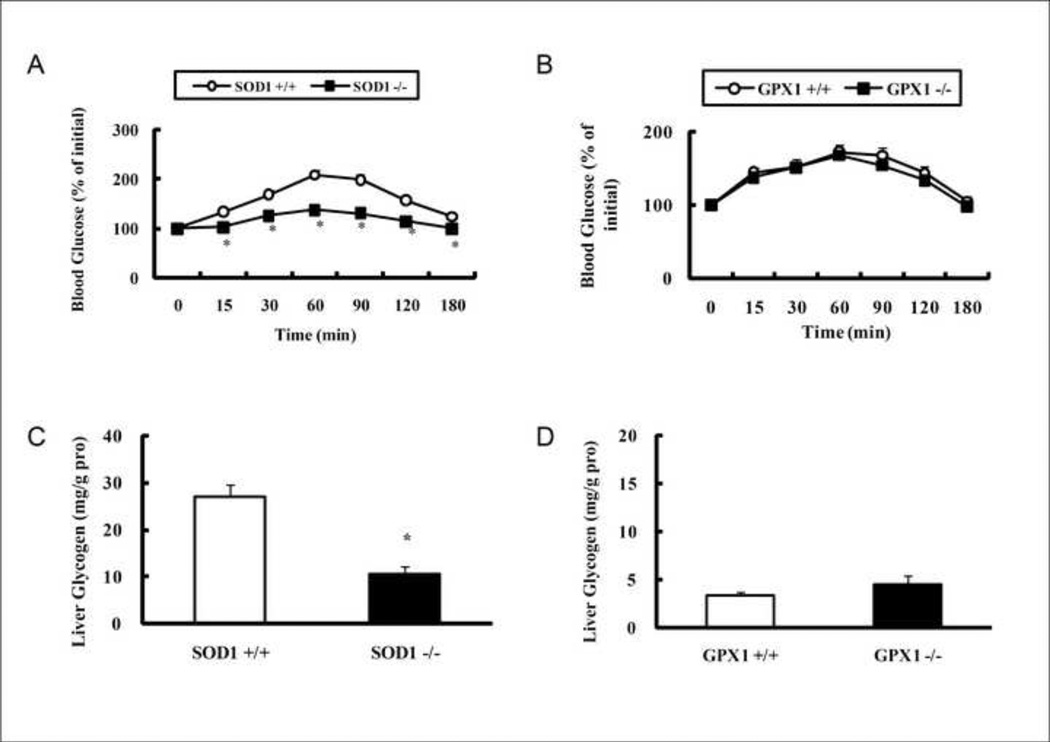
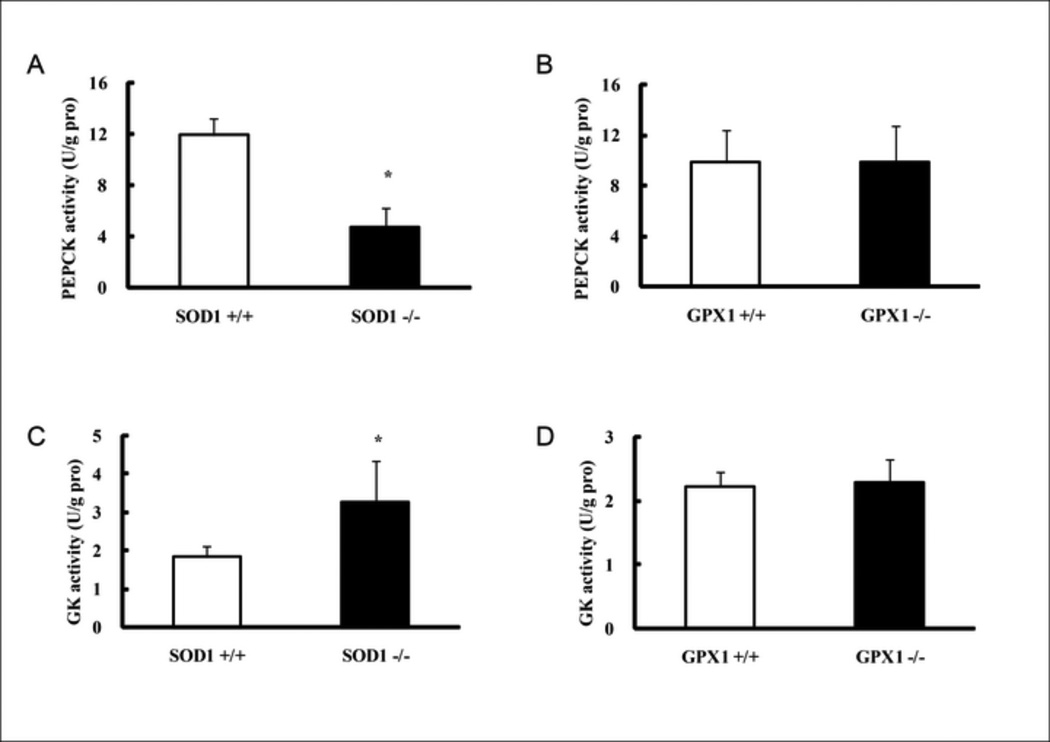
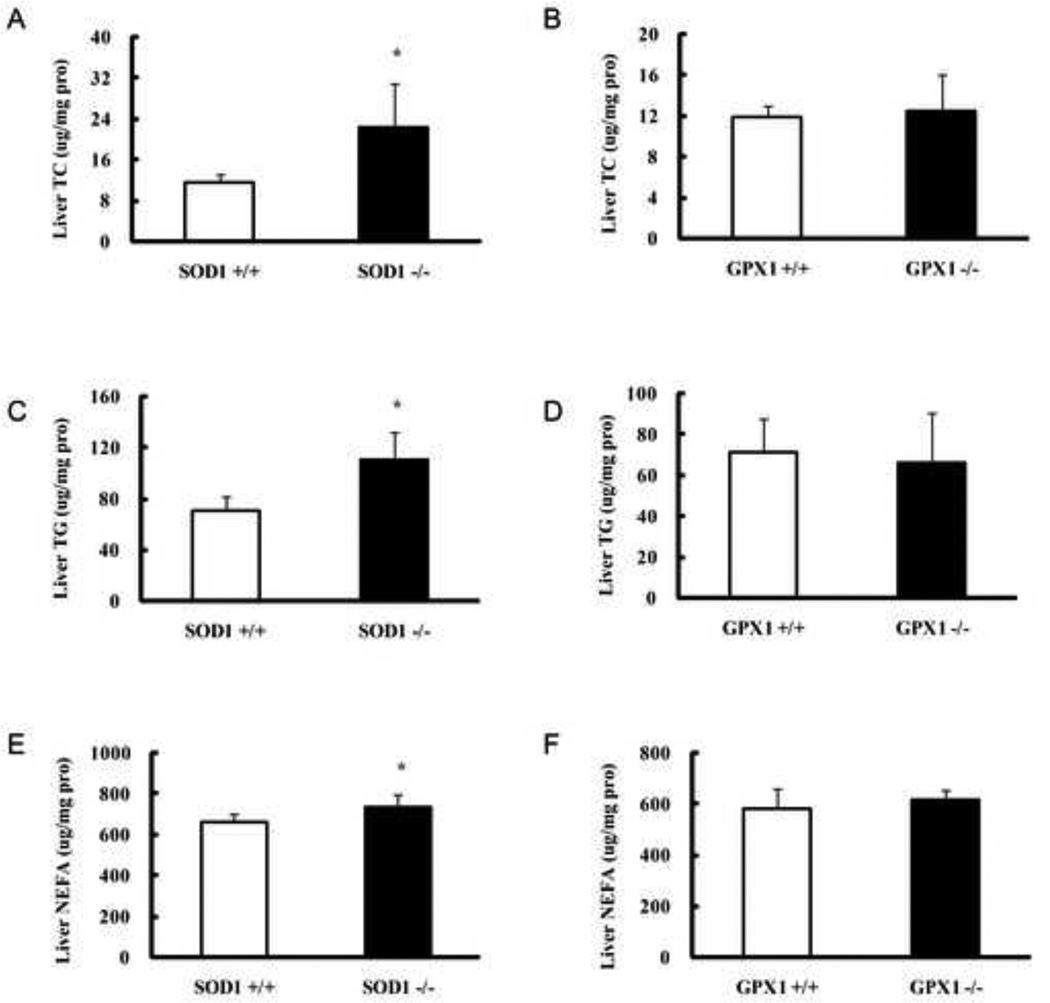
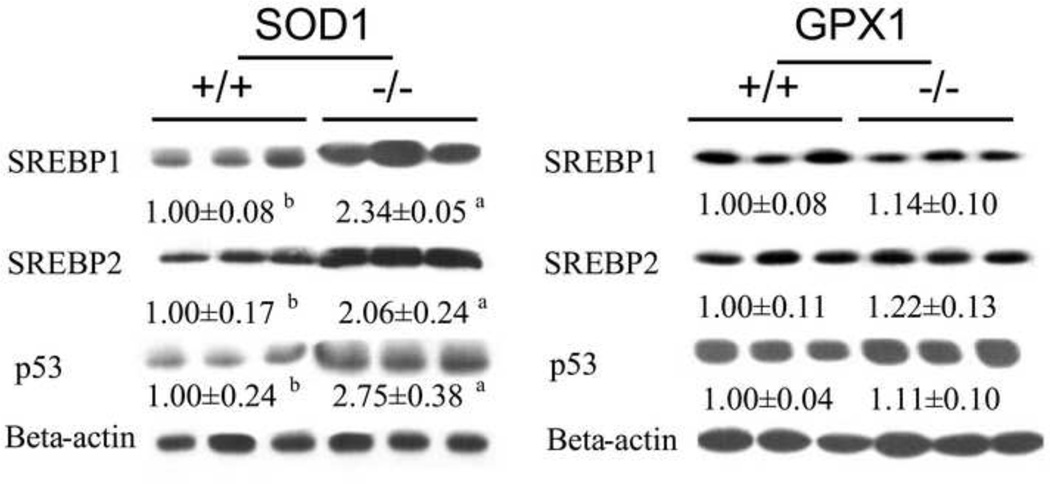
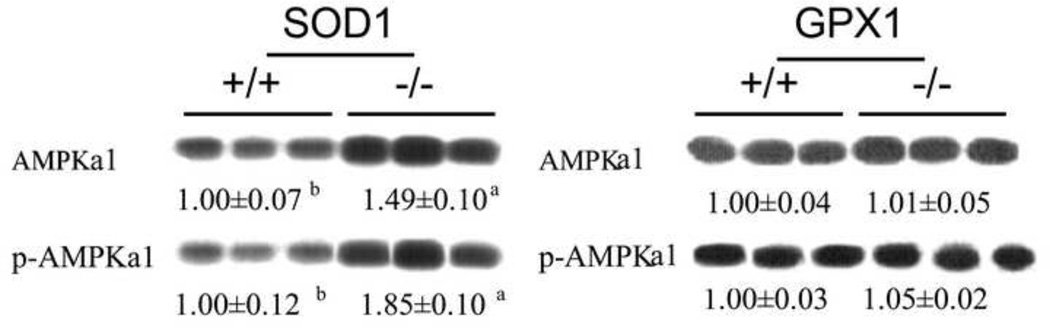
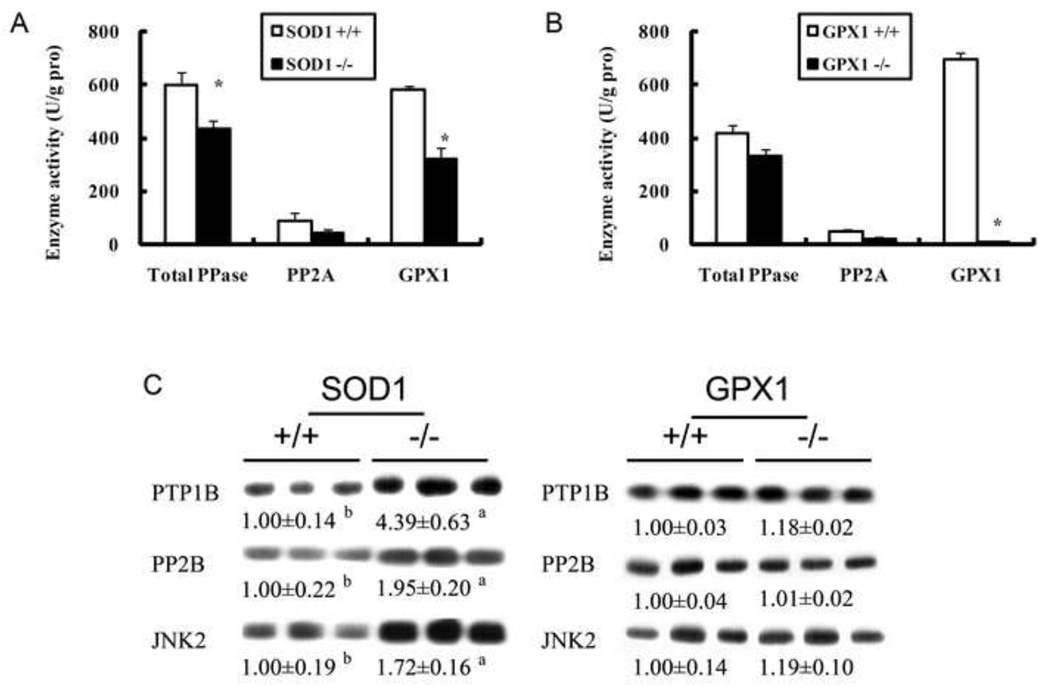
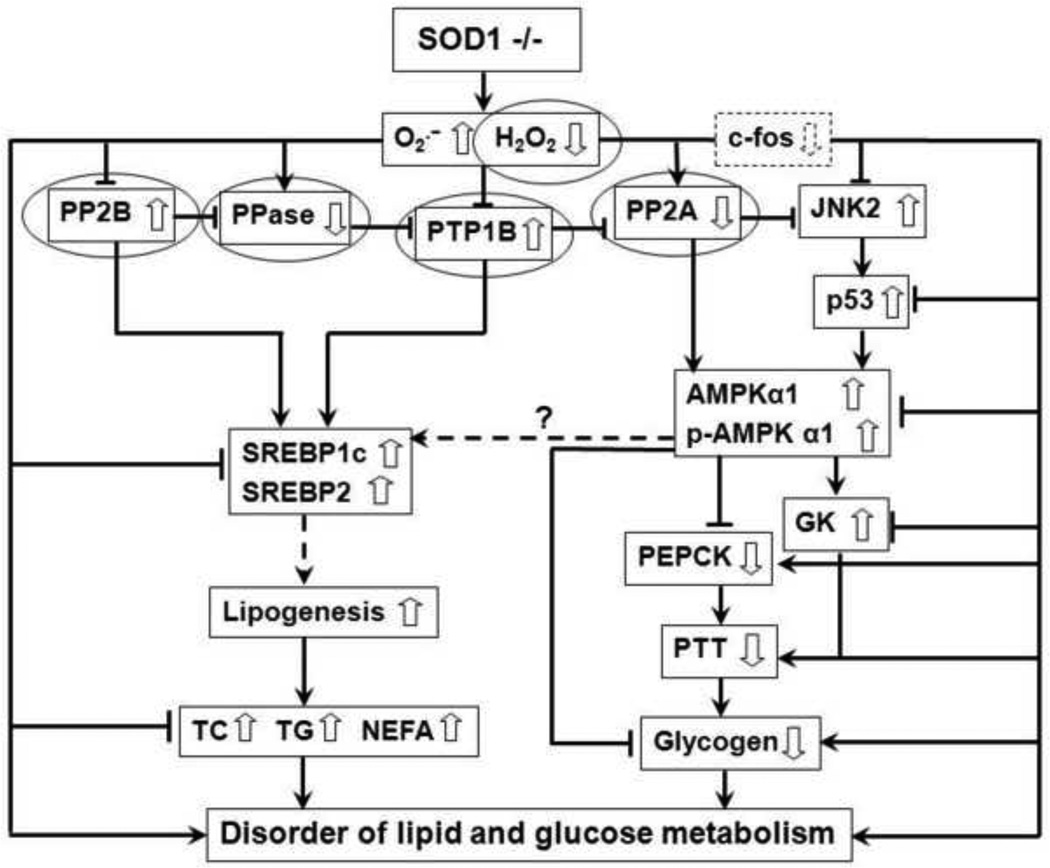
We previously observed a stronger effect of knockout of Cu,Zn-superoxide dismutase (SOD1) than that of Se-dependent glutathione peroxidase 1 (GPX1) on murine body weight and glucose homeostasis. Two experiments were conducted to determine how hepatic lipid profiles and key metabolic regulators were correlated with this difference. SOD1(-/-) and GPX1(-/-) mice and their respective wild-type (WT) littermates (n=6 or 7/group, male) were fed a Se-adequate Torula yeast-sucrose diet and killed at 6 months of age to collect liver samples. In Experiment 1, fasted SOD1(-/-) mice displayed pyruvate intolerance and a 61% decrease (P<0.05) in liver glycogen compared with their WT littermates. The former had lower (P<0.05) activities of phosphoenolpyruvate carboxykinase, total protein phosphatase, and protein phosphatase 2A, but a higher (P<0.05) activity of glucokinase in the liver than the latter. In contrast, hepatic concentrations of total cholesterol, triglycerides, and nonesterified fatty acids were increased by 11 to 100% (P<0.05) in the SOD1(-/-) mice. Meanwhile, these mice had elevated (P<0.05) hepatic protein levels of sterol-regulatory element binding proteins 1 and 2, p53 MAPK, total and phosphorylated AMP-activated protein kinase α1 protein, protein tyrosine phosphatase 1B, and protein phosphatase 2B. In Experiment 2, GPX1(-/-) mice and their WT littermates were compared, but showed no difference in any of the measures. In conclusion, knockout of SOD1, but not GPX1, led to a decreased liver glycogen storage synchronized with pyruvate intolerance and elevated hepatic lipid profiles in adult mice. This striking comparison was possibly due to unique impacts of these two knockouts on intracellular tone of H(2)O(2) and key regulators of liver gluconeogenesis, glycolysis, and lipogenesis.
Copyright © 2012 Elsevier Inc. All rights reserved.
Figures
References
-
- Fonseca VA. The metabolic syndrome, hyperlipidemia, and insulin resistance. Clin Cornerstone. 2005;7:61–72. - PubMed
-
- Ross R, Aru J, Freeman J, Hudson R, Janssen I. Abdominal adiposity and insulin resistance in obese men. Am. J. Physiol. Endocrinol. Metab. 2002;282:E657–E663. - PubMed
-
- Landin K, Tengborn L, Smith U. Elevated fibrinogen and plasminogen activator inhibitor (PAI-1) in hypertension are related to metabolic risk factors for cardiovascular disease. J. Intern. Med. 1990;227:273–278. - PubMed
-
- Hamaguchi M, Kojima T, Takeda N, Nakagawa T, Taniguchi H, Fujii K, Omatsu T, Nakajima T, Sarui H, Shimazaki M, Kato T, Okuda J, Ida K. The metabolic syndrome as a predictor of nonalcoholic fatty liver disease. Ann. Intern. Med. 2005;143:722–728. - PubMed
-
- Grundy SM. Does a diagnosis of metabolic syndrome have value in clinical practice? Am. J. Clin. Nutr. 2006;83:1248–1251. - PubMed
Publication types
MeSH terms
Substances
Grants and funding
LinkOut - more resources
Full Text Sources
Molecular Biology Databases
Research Materials
Miscellaneous
