. 2012 Sep 11;23(3):573-86.
doi: 10.1016/j.devcel.2012.08.002.

Lipid sorting by ceramide structure from plasma membrane to ER for the cholera toxin receptor ganglioside GM1

Affiliations

Lipid sorting by ceramide structure from plasma membrane to ER for the cholera toxin receptor ganglioside GM1

Daniel J-F Chinnapen et al. Dev Cell. .

Abstract

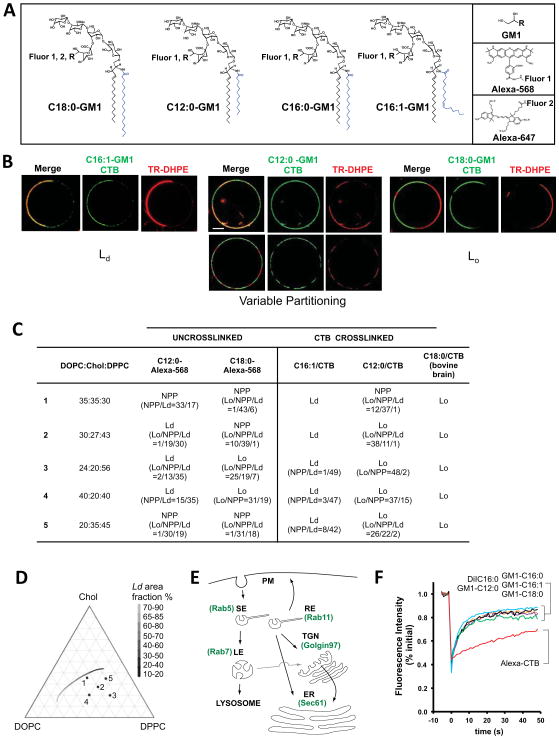
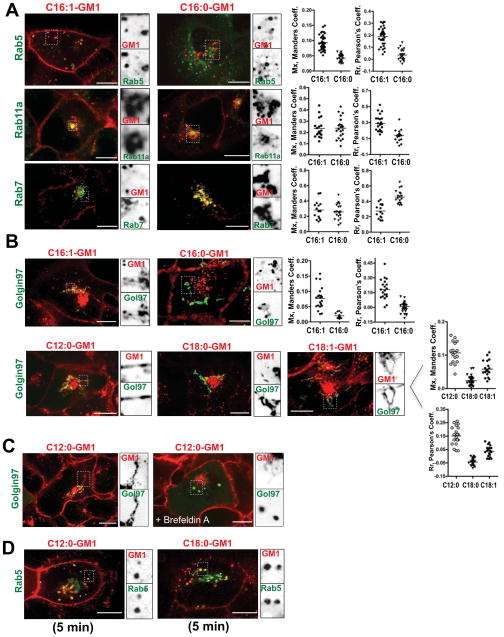
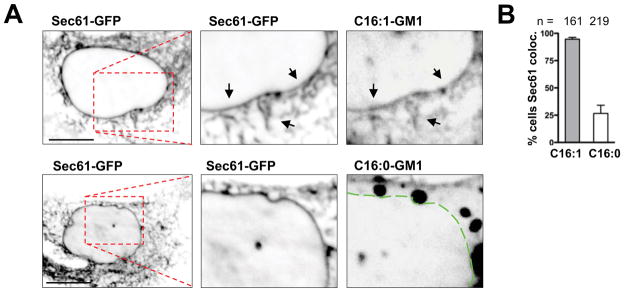
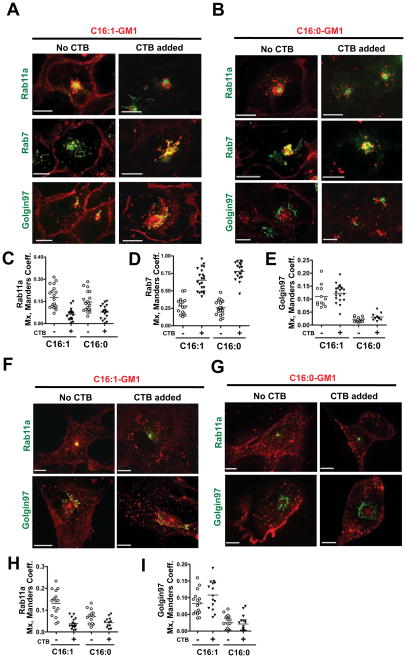
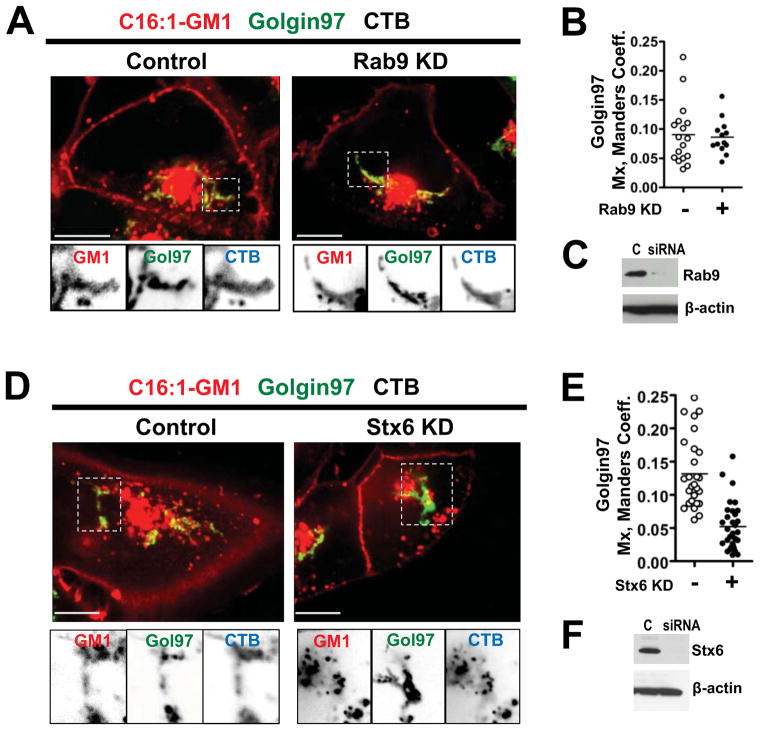
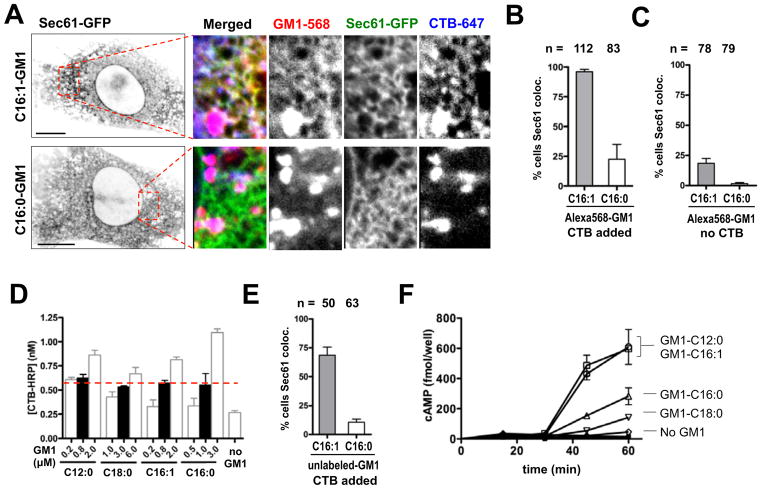
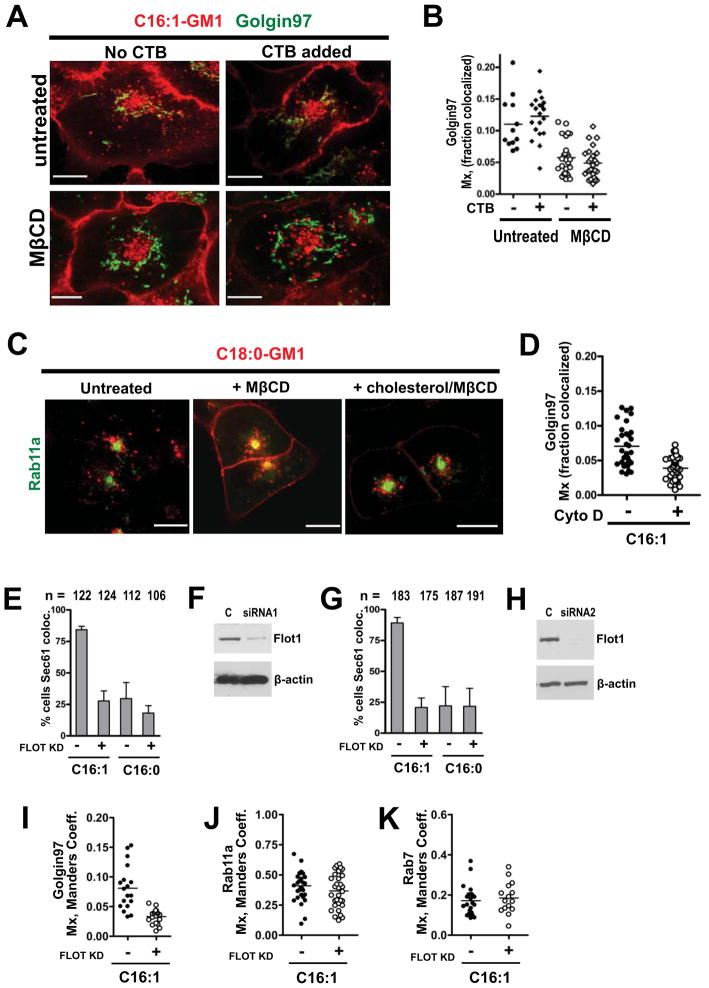
The glycosphingolipid GM1 binds cholera toxin (CT) on host cells and carries it retrograde from the plasma membrane (PM) through endosomes, the trans-Golgi (TGN), and the endoplasmic reticulum (ER) to induce toxicity. To elucidate how a membrane lipid can specify trafficking in these pathways, we synthesized GM1 isoforms with alternate ceramide domains and imaged their trafficking in live cells. Only GM1 with unsaturated acyl chains sorted efficiently from PM to TGN and ER. Toxin binding, which effectively crosslinks GM1 lipids, was dispensable, but membrane cholesterol and the lipid raft-associated proteins actin and flotillin were required. The results implicate a protein-dependent mechanism of lipid sorting by ceramide structure and provide a molecular explanation for the diversity and specificity of retrograde trafficking by CT in host cells.


Conflict of interest statement

The authors report no conflict of interests.

Figures

Figure 1
Figure 1. GM1 with different ceramide domains partition into Lo or Ld regions of artificial membranes
A: Structures of GM1 synthesized, Alexa Fluors used and site of conjugation to sialic acid. See also Supplemental Figure S1 and Table S1. B: Confocal equatorial images of GUVs with DOPC:Chol:DPPC compositions 1 or 3 (Panel c) show different phase partitioning of GM1-CTB complexes, TR-DHPE (red, marking Ld) and GM1-CTB-Alexa488 (green). Left GUV-composition-1: CTB-C16:1 GM1 complex shows Ld phase preference. Middle (top) GUV-composition-1: CTB-C12:0 GM1 complex shows variable phase partitioning. Middle (bottom) GUV-composition-3: CTB-C12:0 GM1 complex shows Lo phase preference. Right GUV-composition-1: CTB-C18:0 GM1 complex shows Lo phase preference. Bar = 10 μm. C: Phase partitioning of Alexa-labeled GM1 and crosslinked GM1-CTB-A488 complexes in GUVs of different lipid cholesterol compositions. When variable, the ratios for the number of vesicles with the observed phases are shown in the parentheses. D: Partial ternary phase diagram showing the five GUV lipid-compositions used in these studies. The gray scale line shows the approximate position of a phase coexistence boundary (Tian et al., 2009; Veatch and Keller, 2003) and referencing the domain area fraction of the Ld phase, which decreases with increasing DPPC content (Tian et al., 2009). E: Schematic of endocytic and retrograde pathways and EGFP-fusion proteins used to mark the indicated compartments. F: Confocal FRAP of the different Alexa-labeled GM1 species introduced into A431 cells. All GM1 variants (containing fatty acids: C12:0 – orange line, C16:0 – purple line, C16:1 – black line, C18:0 green-line) displayed D values of approximately 1.3 um2/s nearly equal to that of an established lipid probe, DiIC16 (~1.87um2/s, blue line). Alexa-555 CTB (red line) diffused substantially slower (D ~ 0.08 um2/s). See also Figure S1.
Figure 2
Figure 2. Intracellular distribution of the different GM1 species
A,B: Confocal images of live A431 cells stably expressing EGFP fusion proteins as indicated (Figure 1E). Cells were imaged 50–60 minutes after loading with Alexa-labeled 1.6 μM C16:1- or 2.0 μM C16:0- GM1 molecular species (A), and 1.0 μM C12:0, 2.0 μM C18:0 and C18:1 Alexa-GM1 variants (B). Inverted grayscale images of selected areas (dotted box) for individual fluorescence channels are shown to the right of the merged images. Histograms (far right) show quantitation of GM1 localized to the respective compartment using Manders (Mx), or Pearson’s (Rr) coefficients for at least 3 independent experiments. Each dot represents a correlation coefficient calculated from a single field of view containing 2 – 3 cells on average. Overall brightness of the red channels in (B) images was enhanced to better visualize TGN signals. C: As for panels (A) and (B) using Golgin97-EGFP expressing cells pretreated, or not with 10 μM Brefeldin A followed by uptake for 60 minutes of Alexa-labeled C12:0-GM1. Fraction of lipid signal in the TGN were Mx = 0.088 for untreated versus Mx = 0.007 for Brefeldin A –treated cells. N = 26 cells analyzed per treatment. D: As for panels (A) and (B) using cells loaded with short chain (C12:0) or long chain (C18:0) Alexa-GM1 and imaged after 5 minutes uptake. The fraction of total lipid in the Rab5 compartment at this time point were 0.07 for C12:0-GM1 and 0.11 for C18:0-GM1. N = 45 cells analyzed per treatment. Scale bars = 10 μm. See also Figure S2.
Figure 3
Figure 3. GM1 isoforms with unsaturated acyl chains move efficiently from PM to ER
A: Confocal images of live A431 cells expressing Sec61-EGFP and incubated 18 hours with Alexa568-labeled C16:0- or C16:1-GM1 isoforms. Arrows and dotted line indicate nuclear envelope/ER. B: Quantification of three independent experiments shown in panel A. (mean ± SEM) See also Figure S3.
Figure 4
Figure 4. Effect of crosslinking GM1 by binding to CTB
A: A431 cells loaded with C16:1-GM1 and incubated with or without 40 nM CTB (Right and Left panels respectively). Scale bars = 10 μm. B: Same as in panel (A) using A431 cells loaded with Alexa C16:0-GM1. C–E: Histograms quantitating the colocalization (Mx) of the C16:1- and C16:0-GM1 molecular species with Rab11a, Rab7 and Golgin97 compartments in cells treated with CTB (filled triangles) or with no toxin (open circles). F: C16:1-GM1 Alexa568 loaded MEF-GM1−/− cells transiently expressing Rab11a (upper panels) and Golgin97-EGFP (lower panels) treated with 40 nM CTB or without toxin. G: C16:0-GM1 loaded MEF-GM1−/− cells and treated as in (F). H and I: Histograms quantitating the colocalization of the C16:1- and C16:0-GM1 isoforms with Rab11a and Golgin97 compartments as indicated. Open circles (no toxin) and filled triangles (plus CTB) as in Panels (C & D). N = 2 independent experiments. Scale bars = 10 μm.
Figure 5
Figure 5. The CT-GM1 complex moves from the SE/RE directly to the TGN
A: A431 cells expressing Golgin97-EGFP and transfected with Rab9 siRNA (right), or controls (left), before incubations with Alexa-labeled C16:1-GM1 and CTB. Inverted grayscale images of selected areas (dotted box) for each channel shown below. B: Histograms quantitating the colocalization of the Alexa GM1-C16:1 complex with Golgin97 in cells transfected with Rab9 siRNA (closed circles), or in controls (open circles). C: Immunoblots of cell lysates probed with mouse anti-Rab9 antibody (upper panel) or with mouse anti-β-actin (lower panel). D: A431 cells transfected with Stx6 siRNA (right), or controls (left) and treated as in (A). E: Histograms quantitating the colocalization of Alexa C16:1 GM1 with Golgin97 in cells transfected with syntaxin6 (Stx6) siRNA as in (D). F: Immunoblots probed with mouse anti-Stx6 antibody (upper panel) or with mouse anti-β-actin (lower panel).
Figure 6
Figure 6. Crosslinked unsaturated acyl chains traffic retrograde more efficiently to the ER
A: Confocal images of Alexa-labeled C16-GM1 isoforms (3.2 μM C16:1-GM1, or 4.0 μM C16:0-GM1) in MEF-GM1−/− cells after 5 hour incubation with 40 nM CTB-A647. Inverted grayscale images of Sec61a-EGFP for the entire cell (far Left, bar = 10μm), 3-color merge and grayscale images of the individual channels (right panels, bar = 10μm). B: Fraction of MEF-GM1−/− cells showing Sec61/ER colocalization for Alexa-labeled C16:1 and C16:0 following CTB treatment for 5 hours. n = 112 and 83 cells counted respectively. C: Experiments performed as in (B) but with no CTB crosslinking. D: Doses probed for each unlabeled GM1 isoform incorporated into the PM of MEF-GM1−/− cells as measured by enzymatic assay for surface-bound CTB-HRP conjugate. Cells were incubated with 20 nM CTB-HRP to label the PM at 4°C. Filled-bars indicate the conditions used in subsequent studies to load cells equally (red dotted line). (mean ± SEM, N = 3) E: Fraction of MEF-GM1−/− cells showing Sec61/ER colocalization for unlabeled C16-GM1 variants following 20 nM CTB-Alexa594 treatment for 5 hours. F: Time course of toxin-induced intracellular cAMP production in MEF-GM1−/− cells. (mean ± SEM, N = 3) Bar graphs in B, C & E show mean ± SEM for N = 3 independent scores. See also Figure S4.
Figure 7
Figure 7. Retrograde trafficking for the unsaturated C16:1-GM1 species depends on cholesterol, actin and flotillin-1
A: A431 cells expressing Golgin97-EGFP were depleted of membrane cholesterol with 5 mM MβCD (bottom panels), or not treated (top panels) and loaded with Alexa-labeled C16:1-GM1 followed by treatment with 40 nM CTB. B: Histogram quantitating the colocalization of C16:1-GM1 with Golgin97 in cholesterol depleted (right columns), or control (left columns) cells treated or not with CTB. Each data point represents a field of view containing 2–3 cells on average. C: Alexa568 C18:0-GM1 was loaded into A431 cells expressing Rab11-EGFP that were untreated (left panel – Mx = 0.05) or treated with MβCD (middle panel - Mx = 0.13). Panel to right shows cholesterol depleted cells repleted with cholesterol Mx = 0.05. N = 43 cells analyzed per treatment. D: Histograms quantitating the fraction of C16:1-GM1 colocalizing with the TGN in Golgin97 – expressing A431 cells pre-treated with 20 μM cytochalasin D to depolymerize actin. E: Fraction of A431 cells with C16:1 or C16:0 Alexa GM1 colocalized in Sec61-EGFP ER/nuclear envelope. Cells transfected with flotillin-1 siRNA and control siRNA were studied and scored by three investigators blinded to treatment groups. F: Representative immunoblot probed with mouse antibody against flotillin-1 or β-actin in A431 cell lysates. G & H: same as in panels (E) and (F) using siRNA against flotillin-1 obtained from a different source. I – K: Histograms quantitating colocalization of the C16:1 Alexa-GM1 isoform with Golgin97 (I), Rab11a (J) and Rab7 (K) in cells transfected with Flotillin1 siRNA (open circles), or untransfected controls (closed circles). (Bar graphs show mean ± SEM, N = 3 independent scores.)

References

    1. Arab S, Lingwood CA. Influence of phospholipid chain length on verotoxin/globotriaosyl ceramide binding in model membranes: comparison of a supported b film and liposomes. Glycoconj J. 1996;13:159–166. - PubMed
    1. Badizadegan K, Wheeler HE, Fujinaga Y, Lencer WI. Trafficking of cholera toxin-ganglioside GM1 complex into Golgi and induction of toxicity depend on actin cytoskeleton. Am J Physiol Cell Physiol. 2004;287:C1453–1462. - PubMed
    1. Baumgart T, Hammond AT, Sengupta P, Hess ST, Holowka DA, Baird BA, Webb WW. Large-scale fluid/fluid phase separation of proteins and lipids in giant plasma membrane vesicles. Proc Natl Acad Sci U S A. 2007;104:3165–3170. - PMC - PubMed
    1. Bhagatji P, Leventis R, Comeau J, Refaei M, Silvius JR. Steric and not structure-specific factors dictate the endocytic mechanism of glycosylphosphatidylinositol-anchored proteins. J Cell Biol. 2009;186:615–628. - PMC - PubMed
    1. Brown FL, Leitner DM, McCammon JA, Wilson KR. Lateral diffusion of membrane proteins in the presence of static and dynamic corrals: suggestions for appropriate observables. Biophys J. 2000;78:2257–2269. - PMC - PubMed

Publication types

MeSH terms

LinkOut - more resources