. 2012 Sep 11;22(3):291-303.
doi: 10.1016/j.ccr.2012.07.023.

TGF-β-miR-34a-CCL22 signaling-induced Treg cell recruitment promotes venous metastases of HBV-positive hepatocellular carcinoma

Affiliations

TGF-β-miR-34a-CCL22 signaling-induced Treg cell recruitment promotes venous metastases of HBV-positive hepatocellular carcinoma

Pengyuan Yang et al. Cancer Cell. .

Abstract

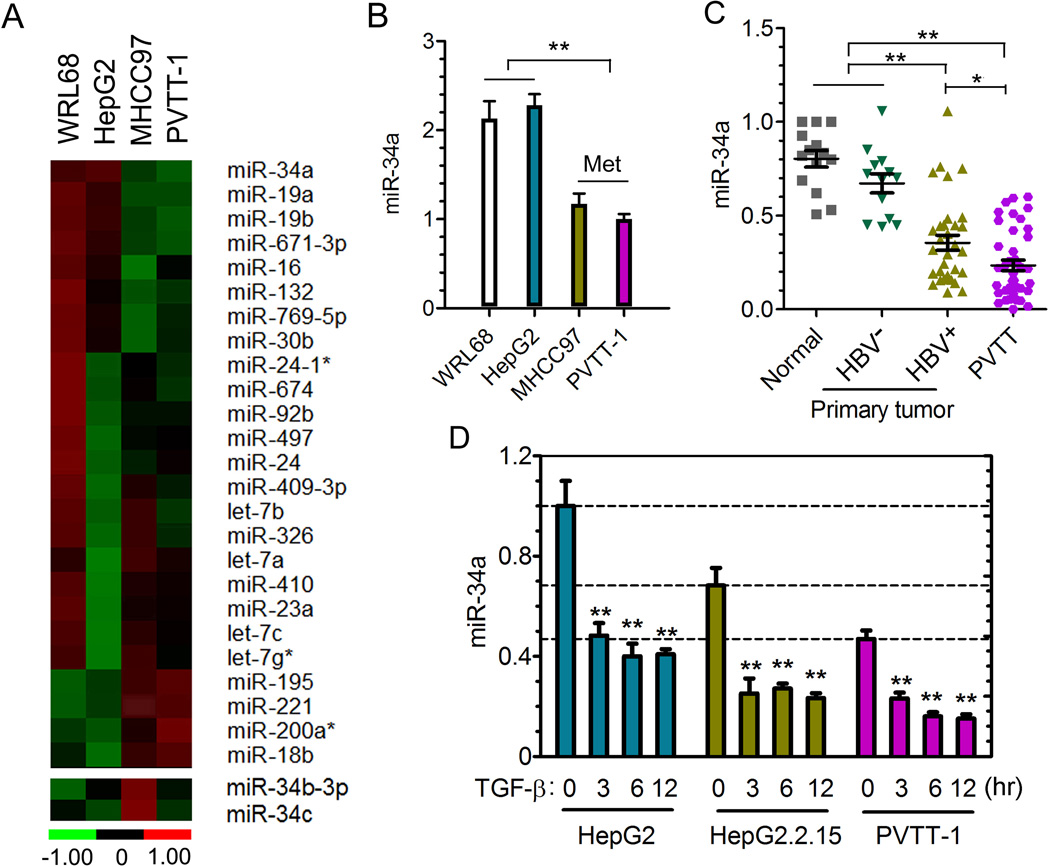
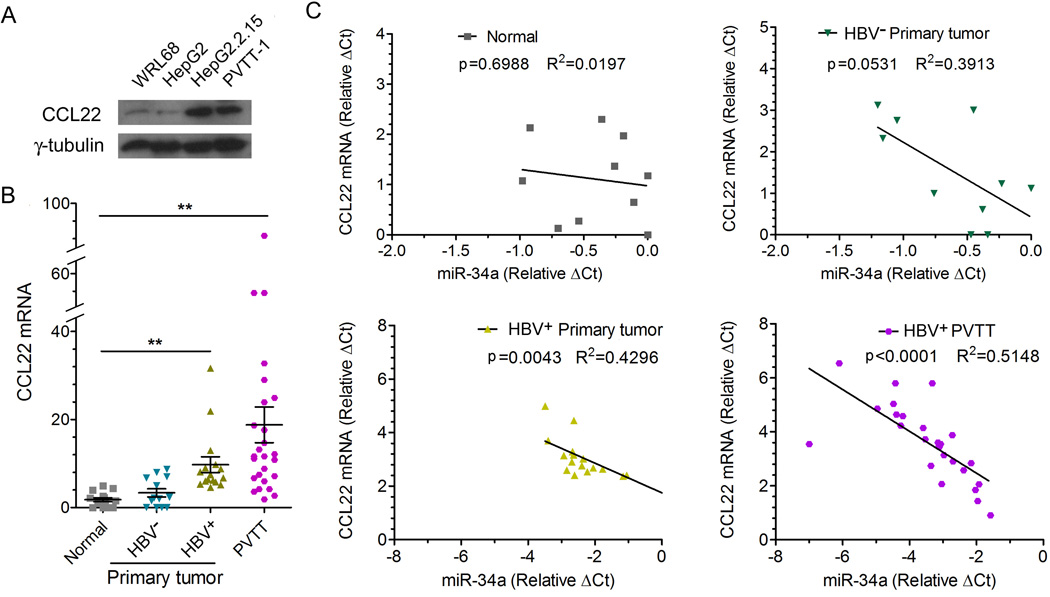
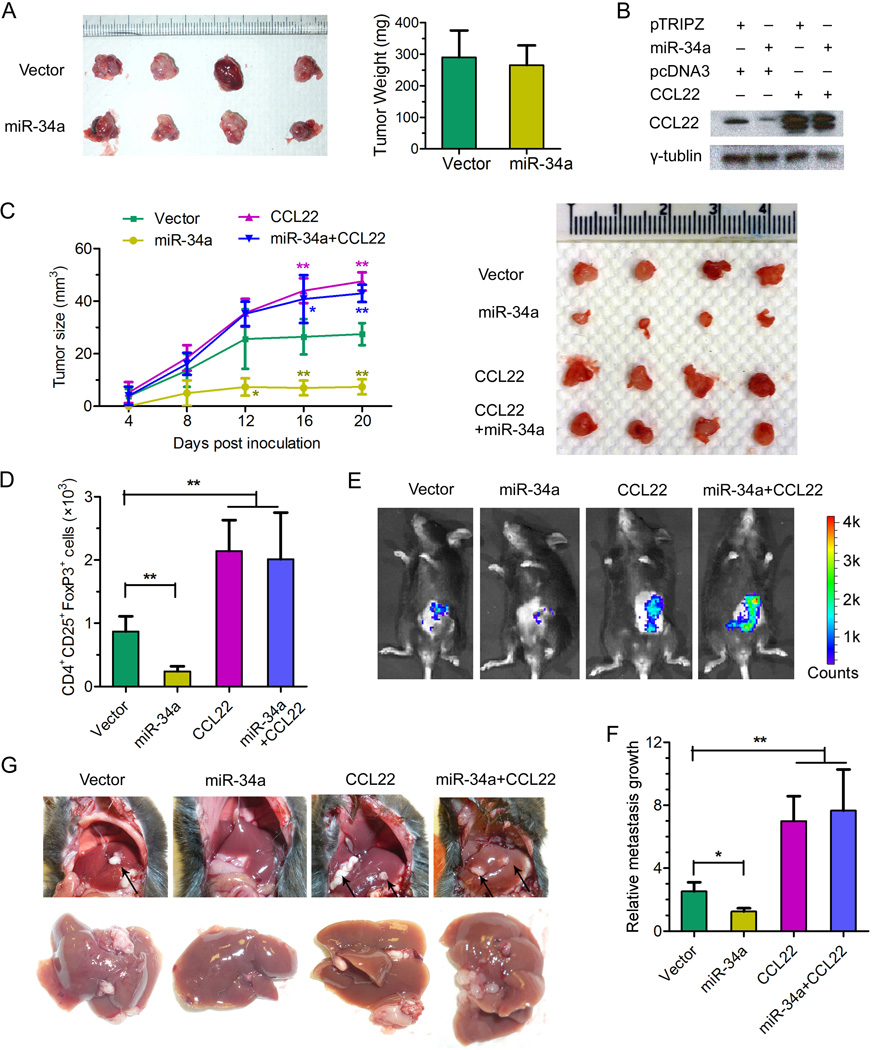
Portal vein tumor thrombus (PVTT) is strongly correlated to a poor prognosis for patients with hepatocellular carcinoma (HCC). In this study, we uncovered a causative link between hepatitis B virus (HBV) infection and development of PVTT. Mechanistically, elevated TGF-β activity, associated with the persistent presence of HBV in the liver tissue, suppresses the expression of microRNA-34a, leading to enhanced production of chemokine CCL22, which recruits regulatory T (Treg) cells to facilitate immune escape. These findings strongly suggest that HBV infection and activity of the TGF-β-miR-34a-CCL22 axis serve as potent etiological factors to predispose HCC patients for the development of PVTT, possibly through the creation of an immune-subversive microenvironment to favor colonization of disseminated HCC cells in the portal venous system.


Figures

Figure 1
Figure 1. HBV infection status and TGF-β signaling activity are associated with development of PVTT in human HCC patients
(A) Kaplan-Meier Survival curves of HCC patients with PVTT in comparison with those without PVTT detected at the time of surgical operation. Clinical characteristics of those patients are presented in Table 1. (B) Kaplan-Meier survival curves of HCC patients shown in Table 1 with different degree of PVTT development based on the extent of venous tumor thrombus formation. Type I: Tumor thrombi involving segmental branches of the portal vein or above; Type II: Tumor thrombi involving right/left portal vein; Type III: Tumor thrombi involving the main portal vein trunk; Type IV: Tumor thrombi involving the superior mesenteric vein. (C) Percentage of HBV infection in HCC patients with PVTT compared with those without PVTT. “Others” in the PVTT group include 3 HCV+ patients and 20 patients without the information of their hepatitis viral infection status. “Others” in the HCC without PVTT group include 1 HCC patient without information of hepatitis viral infection status, as well as 6 additional patients who were HBV that were not a part of the original set of the 288 patients analyzed in panels A and B. (D) Kaplan-Meier survival curves of HBV+ verses HBV patients with HCC. The HBV+ group includes 41 HCC patients without PVTT and 209 HCC patients with PVTT; The HBV group includes 12 HCC patients without PVTT and 2 HCC patients with PVTT. 30 of the 294 patients displayed in panel C were excluded from this analysis due to the lack of specific information: 6 HBV patients without PVTT lack survival information; 21 patients lack hepatitis viral infection status; and 3 HCV+ HCC patients. (E) Rate of occurrence of pathological symptoms associated with liver cirrhosis or fibrosis in the 234 HCC patients with PVTT shown in Table 1. (F) IHC of phosphorylated Smad2 in HCC samples. Left: Representative pictures showing different intensities of nuclear staining of pSmad2. Scale bars, 100µm. Lower panels represent magnified pictures (5X) of boxed area in the corresponding upper panels. Right: Box plot graph showing the quantitative evaluation of pSmad2 staining intensity from a tissue microarray. Plot of a box-plot (25%–75%) with whiskers to minimal and maximal of all the score data was used. The statistical differences between the three groups were analyzed by one-way analysis of variance. **p<0.01. (G) TGF-β expression levels in four different liver cell lines. Relative TGF-β1 mRNA level was measured by qRT-PCR and normalized to β-actin. **p<0.01, N=3. (H) 105 HepG2 cells were transfected with 0.5 µg and 1 µg HBx or HBs expression construct, respectively. 24 hrs later, relative amounts of TGF-β1 secreted into the culture media were determined by ELISA. **p<0.01 vs. control vector group, N=3. All error bars indicate mean±SD. See also Figure S1.
Figure 2
Figure 2. Reduced expression of miR-34a is correlated with HBV-positive HCC-PVTT and regulated by TGF-β
(A) Heat map of a partial list of microRNAs whose expression levels differ among the indicated four liver cell lines as determined using an RT-PCR-based miRNA expression array. (B) The relative level of miR-34a of indicated cell lines was measured by qRT-PCR and normalized to the level of U6. N=3. **p<0.01 calculated by student’s t test. (C) The relative level of miR-34a in 26 PVTT tissue samples (all HBV+), 30 primary tumor tissue samples (17 HBV+ and 13 HBV), and 14 normal liver tissues distal to tumor regions was determined by qRT-PCR and normalized to U6. **p<0.01 calculated by student’s t test. (D) The relative level of miR-34a in different cell lines mock-treated or treated with TGF-β1 for indicated time points was measured by qRT-PCR and normalized to U6. N=3. **p<0.01 calculated by student’s t test. All error bars indicate mean±SD. See also Table S1, Figure S2.
Figure 3
Figure 3. The chemokine CCL22 is a bona fide target of miR-34a
(A) PVTT-1 cells were transfected with 80 nM of pre-miR-34a mimetic oligos and a RT-PCR-based expression array was carried out to determine the expression profile of 94 cytokines, chemokines and their receptors 6 hrs later. The expression pattern for 31 out of the 94 genes is presented as representatives. (B) Putative miR-34a binding sites in the 3’-UTR of human CCL22. (C) HEK293T cells were transiently transfected with pre-miR-34a mimetic or control oligos together with the pGL3 control plasmid, a modified pGL3 plasmid containing the wild type CCL22 3’UTR or a mutant CCL22 3’UTR with all three putative target sequences mutated. Pre-miR-34a mimetic or control oligos were added at the indicated concentrations and the luciferase activity was analyzed 24 hrs later. Data is presented as relative firefly luciferase units normalized with the value of renilla luciferase. N=3. ** p<0.01 (Student t-test). (D) PVTT-1 cells were transfected with 80 nM of pre-miR-34a mimetic oligos and the CCL22 mRNA level was determined by qPCR 48 hrs later and normalized to GAPDH. **p<0.01 (Student t-test). (E) PVTT-1 cells were treated as in panel D and CCL22 protein level in culture media was determined by Western blot. γ-tubulin in corresponding cell lysates was used as a loading control. N=3. (F) PVTT-1 cells were transfected with AS-miR-34a or control oligos at the indicated concentrations and the CCL22 level in culture media was determined by Western blot 48 hrs later. γ-tubulin in corresponding cell lysates was used as a loading control. N=3. All error bars indicate mean±SD. See also Figure S3.
Figure 4
Figure 4. CCL22 up-regulation in PVTT is associated with down-regulation of miR-34a
(A) The CCL22 protein level in indicated liver cell lines was determined by Western blot. γ-tubulin was used as a loading control. (B) Tissue specimens from the same set of patients as in Figure 2C were examined for the mRNA level of CCL22 by qRT-PCR and normalized to that of β-actin (CCL22 mRNA was undetectable in 4 normal liver tissues and 2 HBV HCC primary tumor tissues). *p<0.05, **p<0.01 (Student t-test). Mean±SD. (C) Clinical samples from the same set of specimen as in Figures 2C and 4B were analyzed in the four groups as indicated (CCL22 mRNA was undetectable in 4 normal liver tissues and 2 HBV HCC primary tumor tissues). The correlation between miR-34a and CCL22 expression for each individual was assessed by linear regression.
Figure 5
Figure 5. The miR-34a-CCL22 pathway regulates CD4+CD25+ Treg cell recruitment into the tumor microenvironment
(A) 1×10⁵ human CD4+CD25+ Treg cells were tested by transwell assay for their migration towards culture media of PVTT-1 cells harvested 24 hrs after the cells were transfected with different amounts of AS-miR-34a or control oligos as indicated. CCL22 neutralizing or control antibody was added to the culture media of AS-miR-34a oligos transfected PVTT-1 cells to determine the effect on Treg cell migration. 4 hrs after plating of the T cells in the upper chamber, migrated Treg cells were quantified by Cell Counter analysis (N=3, mean±s.d.). **p<0.01 (Student t-test). (B) CCL22 protein (left panel) or mRNA (right panel) level in xenograft tumors tissue samples derived from indicated PVTT-1 cells in nude mice was determined. γ-tubulin was used as a loading control for the Western blot, and mRNA level of CCL22 was normalized to that of GAPDH. N=4. (C) Freshly isolated human CD4+CD25+ or CD4+CD25 T cells were injected via the tail vein into nude mice with xenograft tumors formed by PVTT-1 cells ectopically expressing the vector control or miR-34a as indicated and tumors were extracted 48 hrs later. FACS was used to quantify the number of T cells within 1×10⁸ total cells from each tumor. N=4, Mean±s.d. **p<0.01 (Student t-test). (D) The mRNA level of FoxP3 in HBV+ HCC primary and PVTT samples from the same set of patients as in Figures 2C and 4B was measured by qRT-PCR and normalized to that of β-actin (FoxP3 mRNA was undetectable in 4 normal liver tissues and 2 HBV HCC primary tumor tissues). *p<0.05, **p<0.01 (Student t-test). (E) Treg cell accumulation in HCC primary and PVTT samples was determined by immunohistochemistry staining using an anti-FoxP3 antibody. Representative pictures from one set of the samples are shown. Arrows indicate FoxP3+ Treg cells stained in dark brown color. Scale bars, 100µm. Lower panel represents magnified views (5X) indicated by boxes in the upper panel. (F) Clinical samples from the same set of patients as in Figures 2C and 5D were analyzed in four groups as indicated (FoxP3 mRNA was undetectable in 4 normal liver tissues and 2 HBV HCC primary tumor tissues). The correlation between miR-34a and FoxP3 expression for each individual was assessed by linear regression. All error bars indicate mean±SD. See also Figure S4.
Figure 6
Figure 6. TGF-β positively regulates the production of CCL22 and Treg cell migration via repression of miR-34a in PVTT-1 cells
(A) Time course of TGF-β-induced CCL22 production detected in the culture media of PVTT-1 cells. CCL22 was detected by Western blot and γ-tubulin in corresponding cell lysate was used as a loading control. (B) PVTT-1 cells were pretreated with the control solvent (DMSO) or SB431542 (SB) at 20 µM for 30 min and then treated with TGF-β1 for 12 hrs. The expression of miR-34a (left panel) and of CCL22 mRNA (right panel) were measured by qRT-PCR and normalized to U6 or GAPDH, respectively (N=3, Mean±s.d.). **p<0.01 (Student t-test). (C) PVTT-1 cells were pretreated with various doses of pre-miR-34a mimetic or control oligos for 24 hrs, before TGF-β1 treatment for another 12 hrs as indicated. The level of CCL22 mRNA was measured by qRT-PCR and normalized to GAPDH (left panel). CCL22 protein was detected by Western blot and γ-tubulin was used as a loading control (right panel). (D) The same transwell assay as in Figure 5A was conducted with supernatants from PVTT-1 cells first transfected with pre-miR-34a or control oligos, and 24 hrs later treated with TGF-β1 for another 24 hrs. (N=3, mean±s.d.). **p<0.01 (Student t-test). All error bars indicate mean±SD.
Figure 7
Figure 7. Impact of miR-34a and CCL22 on tumor growth and metastasis associated with Treg cell recruitment to the tumor microenvironment
(A) 5×10⁵ pTRIPZ-miR-34a or pTRIPZ-mock stably transfected Hepa1-6 cells were subcutaneously injected into 6-week-old nude mice. Three weeks later, tumors derived from indicated cells were isolated and shown in the left panel with the plot of their weight displayed in the right panel. N=4. (B) pTRIPZ-miR-34a or pTRIPZ-mock together with pcDNA3-CCL22-ORF or pcDNA3 vector as indicated were stably transfected into Hepa1-6 cells to generate population of cells. 2×10⁶ of each population of those cells were subcutaneously injected into 6-week-old male C57BL/6J mice. The animals were administered Doxcycline 2µg/mouse by gavage every 2 days. After 21 days, CCL22 in tumor tissues was detected by Western blot and γ-tubulin was used as a loading control. (C) The tumor growth curves (left panel) for the same four populations of stably transfected Hepa1-6 cells as described in panel B were measured and the tumors isolated 21 days after inoculation are pictured in the right panel. **p<0.01 (Student t-test). N=4 per experimental group; experiment repeated 3 times. (D) Treg cells were quantified in tumors grown from the four populations of Hepa1-6 cells in C57BL/6J mice. The number of Treg cells from 50 mg of tumor tissue derived from indicated cells was determined via cell counting by flow cytometry. (E) The same four Hepa1-6 populations as described in panel B co-expressing a luciferase reporter were introduced into the C57BL/6J mice via intrasplenic injection. After 21 days, luciferase signals derived from abdominal metastatic tumor growth as shown in the representative images were determined by the Xenogen IVIS Lumina system. (F) Luciferase signal levels from the four groups of mice shown in panel E was normalized to that of control mice without tumor growth, and computed as the values for relative metastatic growth by each of the indicated Hepa1-6 cell populations. *p<0.05, **p<0.01 (Student t-test). N=4 per experimental group; experiment repeated 3 times. (G) Representative pictures showing the formation of tumor metastases in the mouse liver by each of the indicated Hepa1-6 populations. Arrows indicate metastatic tumors in the mouse liver. All error bars indicate mean±SD. See also Figure S5.

Comment in

References

    1. Bao S, Ouyang G, Bai X, Huang Z, Ma C, Liu M, Shao R, Anderson RM, Rich JN, Wang XF. Periostin potently promotes metastatic growth of colon cancer by augmenting cell survival via the Akt/PKB pathway. Cancer Cell. 2004;5:329–339. - PubMed
    1. Bartel DP. MicroRNAs: genomics, biogenesis, mechanism, and function. Cell. 2004;116:281–297. - PubMed
    1. Benhenda S, Cougot D, Buendia MA, Neuveut C. Hepatitis B virus X protein molecular functions and its role in virus life cycle and pathogenesis. Advances in cancer research. 2009;103:75–109. - PubMed
    1. Bierie B, Moses HL. Tumour microenvironment: TGFbeta: the molecular Jekyll and Hyde of cancer. Nat Rev Cancer. 2006;6:506–520. - PubMed
    1. Bissell DM. Chronic liver injury, TGF-beta, and cancer. Exp Mol Med. 2001;33:179–190. - PubMed

Publication types

MeSH terms