. 2012 Sep 11;22(3):304-17.
doi: 10.1016/j.ccr.2012.07.024.

EGF receptor is required for KRAS-induced pancreatic tumorigenesis

Affiliations

EGF receptor is required for KRAS-induced pancreatic tumorigenesis

Christine M Ardito et al. Cancer Cell. .

Abstract

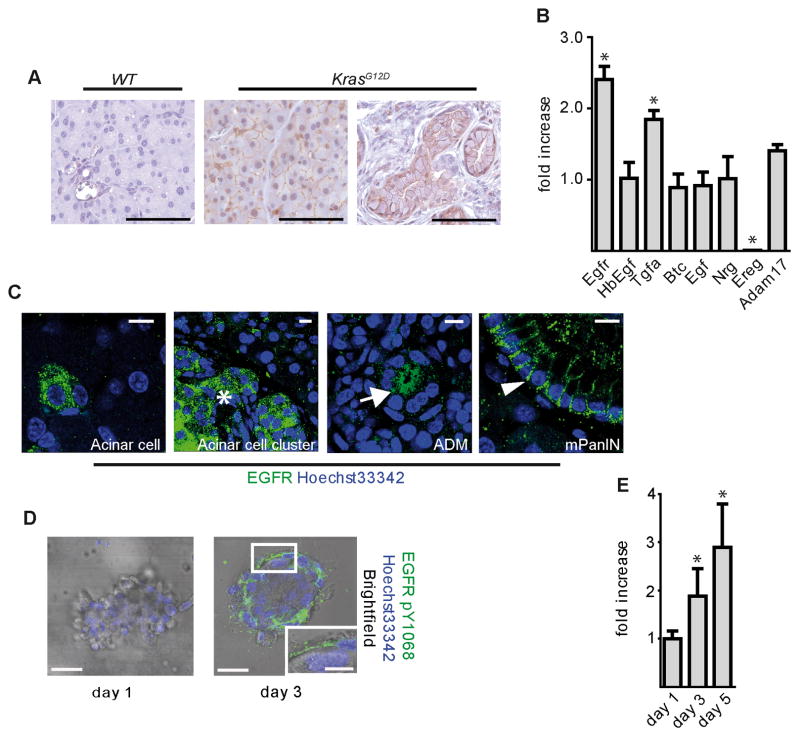
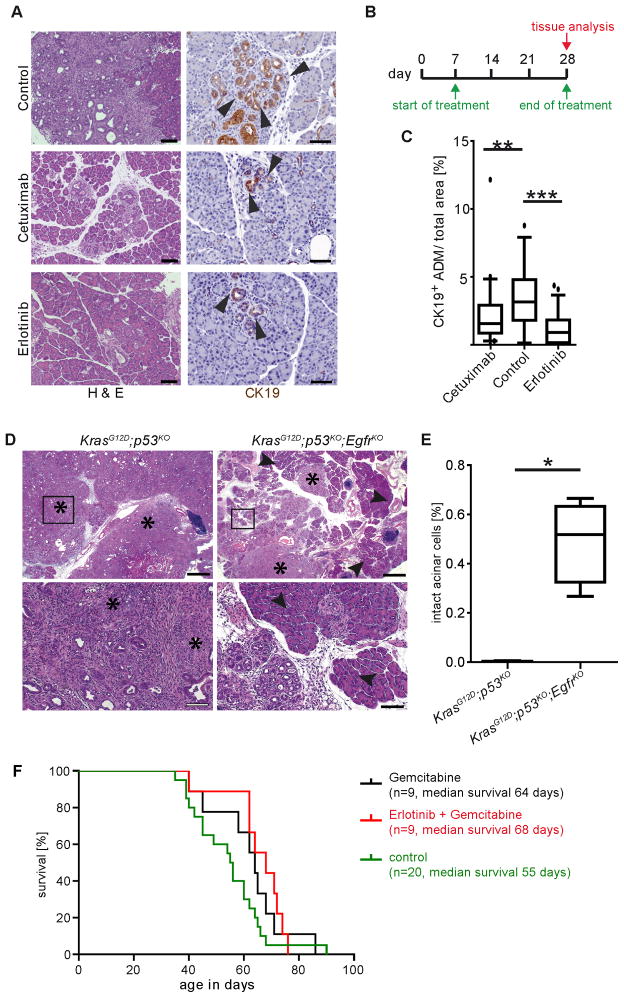
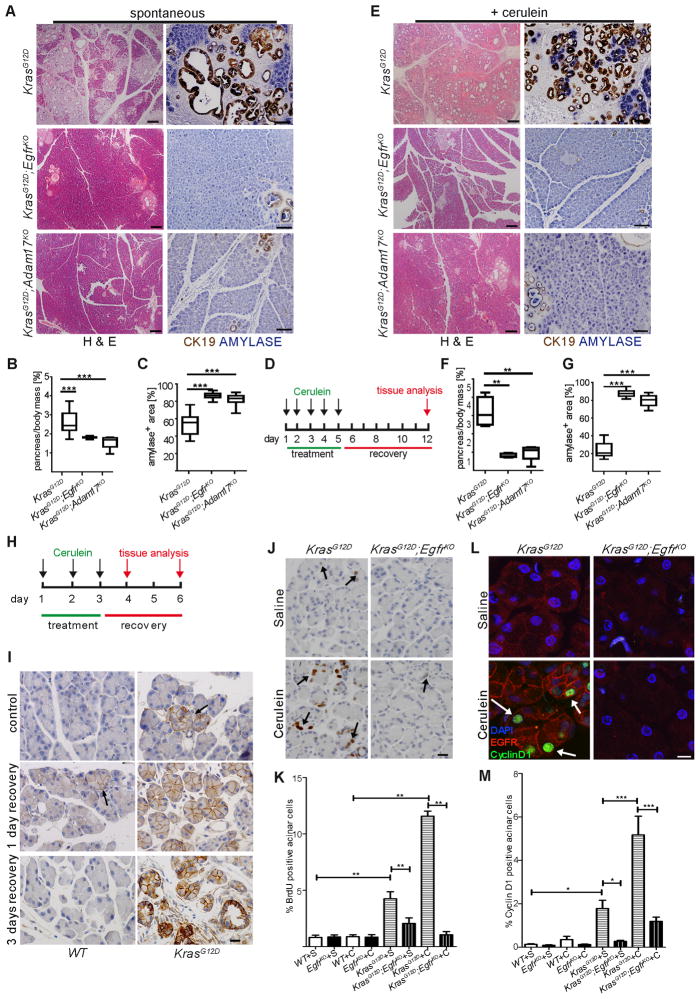
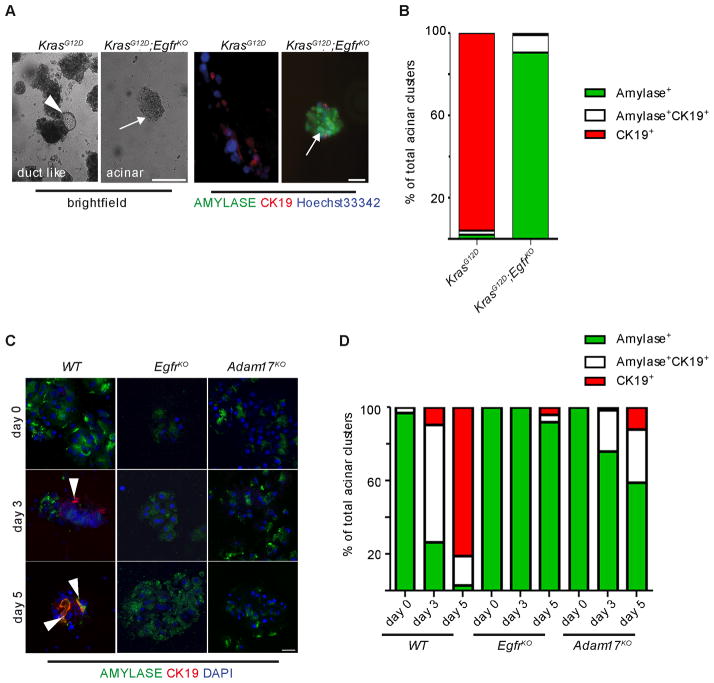
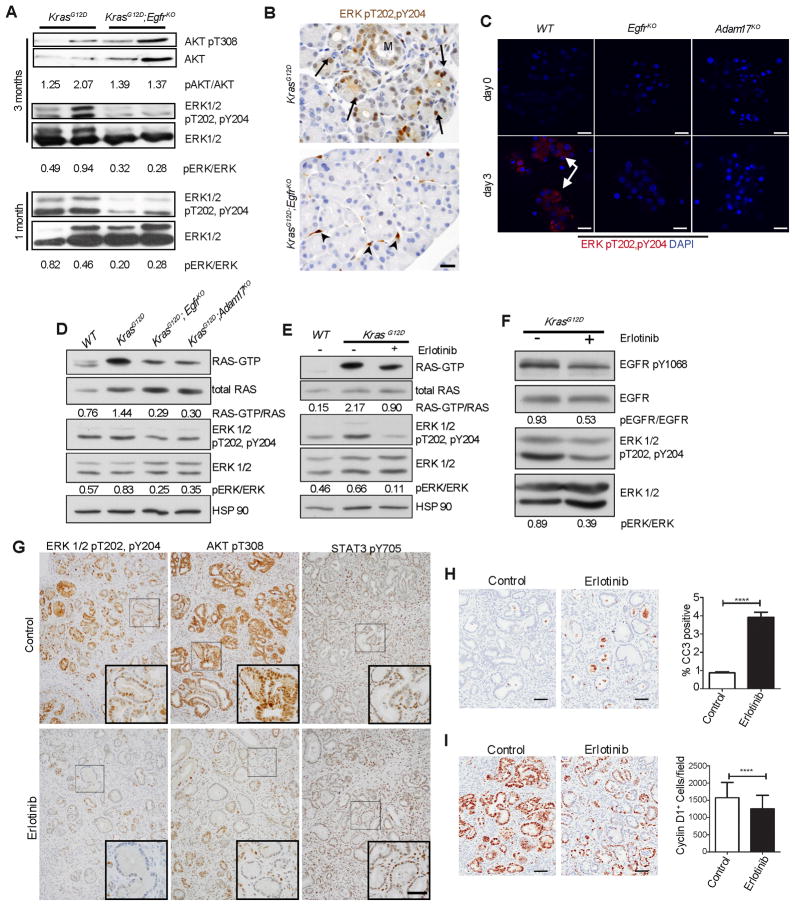
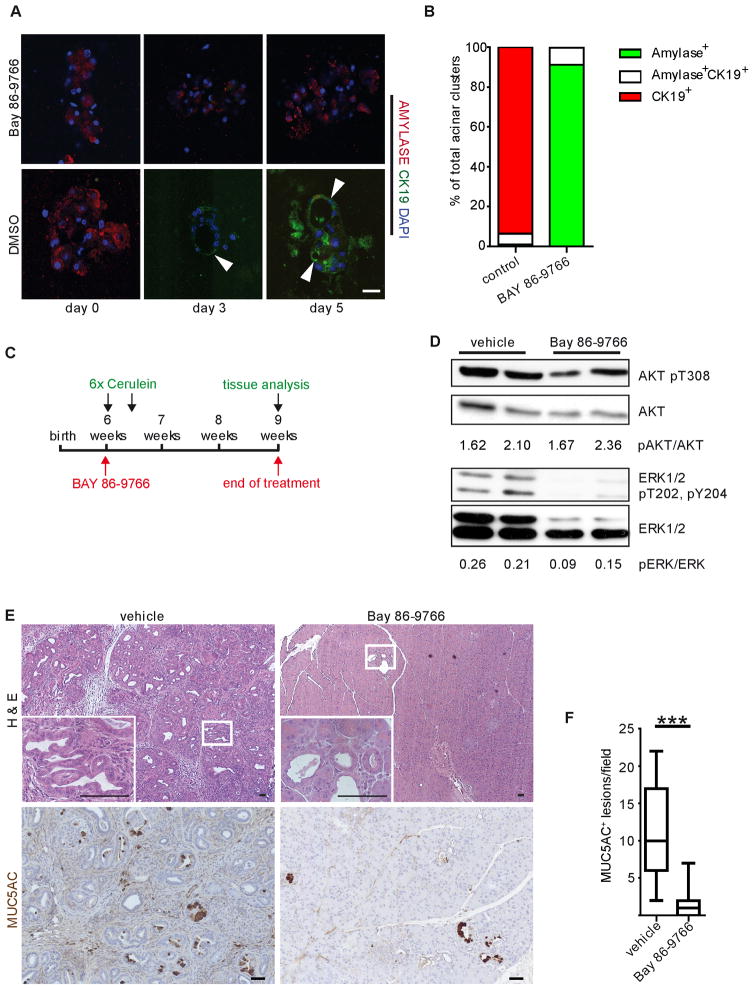
Initiation of pancreatic ductal adenocarcinoma (PDA) is definitively linked to activating mutations in the KRAS oncogene. However, PDA mouse models show that mutant Kras expression early in development gives rise to a normal pancreas, with tumors forming only after a long latency or pancreatitis induction. Here, we show that oncogenic KRAS upregulates endogenous EGFR expression and activation, the latter being dependent on the EGFR ligand sheddase, ADAM17. Genetic ablation or pharmacological inhibition of EGFR or ADAM17 effectively eliminates KRAS-driven tumorigenesis in vivo. Without EGFR activity, active RAS levels are not sufficient to induce robust MEK/ERK activity, a requirement for epithelial transformation.


Conflict of interest statement

The authors have no conflicts of interest.

Figures

Figure 1
Figure 1. EGFR signaling during mPanIN development
(A) IHC for EGFR pY1068 in wild-type and KrasG12D pancreata. Scale bars = 50 μm. (B) qRT-PCR analysis for Egfr, its ligands and Adam17. Error bars are +/− SEM. (n = 3, * p < 0.05). (C) Confocal IF staining for total EGFR in distinct single acinar cells, acinar cell clusters (*), ADM (arrow), and mPanINs (arrowhead) of KrasG12D pancreata. Scale bars = 10 μm. (D) IF for EGFR pY1068 and (E) qRT-PCR analysis of Egfr in KrasG12D acinar cell explants. Scale bars = 10 μm for micrographs, 50 μm for inset. Error bars are +/− SEM (n = 3, * p < 0.05). See also Figure S1.
Figure 2
Figure 2. Inhibition of EGFR signaling blocks KRAS-driven tumorigenesis but not PDA progression
(A) H&E and CK19 IHC of 4 week old KrasG12D;p53KO control, cetuximab and erlotinib treated pancreata. Arrowheads indicate CK19+ structures. Scale bars = 100 μm for H&E and 50 μm for CK19 panels. (B) Schematic of cetuximab and erlotinib treatment protocols. (C) Quantitation of CK19+ structures (n = 3, ** p < 0.01, *** p < 0.001). (D) Histology of 9 week old KrasG12D;p53KO and KrasG12D;p53KO;EgfrKO pancreata. Asterisks indicate areas of invasive PDA. Arrowheads highlight areas of normal acinar tissue. Scale bars, upper panels = 200 μm, lower panels = 50 μm. (E) Quantitation of normal acinar area in KrasG12D;p53KOand KrasG12D;p53KO;EgfrKO pancreata. (F) Kaplan-Meier curve depicting survival of KrasG12D;p53KO mice treated with gemcitabine or erlotinib plus gemcitabine after progression to PDA. See also Figure S2.
Figure 3
Figure 3. Genetic ablation of EGFR activity prevents KRAS-driven PDA development
(A–C) Spontaneous and (D–G) cerulein-induced mPanIN formation in KrasG12D;EgfrKO and KrasG12D;Adam17KO mice compared to KrasG12D controls, shown by H&E (left panels, scale bars = 200 μm) and dual IHC for CK19 (brown) and amylase (blue) (right panels, scale bars = 100 μm). Quantitation of pancreas-to-body weight ratios (B&F) and amylase positive area (C&G) (n > 6, ** p < 0.01, *** p < 0.001) compared to control. (H) Truncated cerulein treatment protocol for analysis of premetaplastic signaling. (I) EGFR IHC in saline-treated (control) and cerulein treated WT (left panels) and KrasG12D (right panels) pancreata with 1 day and 3 days recovery. Arrows indicate focal areas of high EGFR expression. n = 3, scale bars = 20 μm. (J) BrdU incorporation measured by IHC in acinar cells of saline or cerulein-treated KrasG12D and KrasG12D;EgfrKO pancreata with 3 days recovery. Arrows indicate positive acinar nuclei. Scale bar = 20 μm (K) Counts of BrdU+ acinar cells, n=3, **p<0.01. (L) Co-IF for CyclinD1 (green) and EGFR (red) in saline or cerulein-treated KrasG12D and KrasG12D;EgfrKO. Arrows indicate some positive acinar nuclei. Scale bar = 10 μm (M) Quantitation of CyclinD1 expression (*p<0.05,***p<0.001, all other differences were not significant. n=3). Error bars in all panels are +/− SEM. See also Figure S3.
Figure 4
Figure 4. EGFR signaling is required for acinar transdifferentiation in three dimensional primary culture
(A) Light microscopy (left panels) and co-IF for amylase (green) and CK19 (red, right panels) in KrasG12D and KrasG12D;EgfrKO acinar cell explants after three days in three-dimensional collagen culture. Arrowhead indicates area of ductal morphology in KrasG12D explants, compared to maintained acinar cell morphology and amylase expression in KrasG12D;EgfrKO explants (arrows). Scale bars = 20 μm. (B) Quantitation of amylase and CK19 positive acinar clusters on day 3 of culture. (C) Co-IF for amylase (green) and CK19 (red) in cerulein-treated WT (left panels) EgfrKO (middle panels) and Adam17KO acinar cell explants (right panels). Arrowheads indicate CK19+ cells, scale bars = 20 μm. (D) Quantitation of amylase and CK19 positive acinar clusters in cerulein-treated explant cultures. See also Figure S4.
Figure 5
Figure 5. Endogenous EGFR is required for robust activation of RAS and ERK
(A) Western blot analysis of whole pancreatic lysates for active pAKT and pERK in KrasG12D and KrasG12D;EgfrKO mice, at 3 months (upper and middle panels) and pERK at 1 month of age (lower panels). Numbers indicate densitometric quantitation of pERK/total ERK and pAKT/AKT ratios, of representative blots shown. n=4. (B) IHC for active pERK in 6 week old KrasG12D and KrasG12D;EgfrKO pancreata. Arrows indicate areas of focal acinar cell staining. Metaplasia is indicated (M). Arrowheads indicate stromal cell staining. Micrographs are representative of 6 mice. Scale bar = 20 μm (C) IF staining for active pERK in acinar cell explants of cerulein treated wild-type (WT), EgfrKO and Adam17KO explants at 0 and 3 days of culture. Arrows indicate areas of positive staining. Scale bar = 20 μm. (D) Active RAS pulldown assays from lysates of isolated primary acinar cells from wild-type (WT), KrasG12D, KrasG12D;EgfrKO and KrasG12D;Adam17KO mice. Numbers indicate densitometric quantitation of the ratio of GTP-bound and total RAS of representative blots shown. Western blots show concomitant relative ERK activity (pERK/ERK) in these lysates. n=3. (E) GTP-bound RAS/total RAS and pERK/total ERK ratios in isolated acinar cells treated with erlotinib for 6 hours. Numbers indicate quantitation of representative blots shown. n=3. (F) KrasG12D mice were cerulein-treated as in Figure 3D to induce uniform tumorigenesis, then treated with vehicle or 100 mg/kg erlotinib 12, 6 and 2 hours before sacrifice. Shown are western blots of pY1068 and total EGFR and pERK and total ERK. Numbers indicate ratios of representative blots shown. n=3. (G) IHC for active pERK, pAKT and pSTAT3 in vehicle or erlotinib treated mice described in (F). Scale bar = 100μm for primary micrographs, 50μm for insets. (H&I) IHC and quantitation for cleaved caspase-3 (CC3, H) and CyclinD1 (I) in vehicle or erlotinib treated mice described in (F). Scale bars = 50μm. Error bars are +/− SEM. See also Figure S5.
Figure 6
Figure 6. ERK activity is critical for metaplasia and neoplasia
(A) Co-IF for amylase and CK19 in acinar cell explants of KrasG12D mice treated with either the MEK inhibitor BAY 86-9766 or vehicle. Arrowheads point to CK19+ duct-like structures. Scale bar = 20 μm. (B) Quantitation of amylase+ and CK19+ cell clusters is representative of at least 3 independent experiments per treatment. (C) Schematic illustration of pancreatitis induction in KrasG12D mice with a BAY 86-9766 treatment regimen. In 6 week old KrasG12D mice pancreatitis was induced by 6 hourly injections with 50 μg/kg cerulein on two consecutive days. Mice were treated either with a daily oral dose of BAY 86-9766 or vehicle, 6 days per week for 3 consecutive weeks, beginning on the first day of cerulein treatment. (D) Western blot analysis for active pERK and pAKT in control and BAY 86-9766 treated mice. Numbers indicate quantitation of ratios of blots shown, as indicated. (E) Histological analysis and IHC for the PanIN marker MUC5AC in vehicle and BAY 86-9766 treated mice (inset, n = 3). Scale bars = 50 μm. (F) Quantitation of MUC5AC+ lesions in BAY 86-9766 treated mice compared to controls (*** p < 0.001).

Comment in

References

    1. Bardeesy N, Aguirre AJ, Chu GC, Cheng KH, Lopez LV, Hezel AF, Feng B, Brennan C, Weissleder R, Mahmood U, et al. Both p16(Ink4a) and the p19(Arf)-p53 pathway constrain progression of pancreatic adenocarcinoma in the mouse. Proc Natl Acad Sci U S A. 2006;103:5947–5952. - PMC - PubMed
    1. Bardeesy N, Kim M, Xu J, Kim RS, Shen Q, Bosenberg MW, Wong WH, Chin L. Role of epidermal growth factor receptor signaling in RAS-driven melanoma. Mol Cell Biol. 2005;25:4176–4188. - PMC - PubMed
    1. Basu T, Warne PH, Downward J. Role of Shc in the activation of Ras in response to epidermal growth factor and nerve growth factor. Oncogene. 1994;9:3483–3491. - PubMed
    1. Carriere C, Young AL, Gunn JR, Longnecker DS, Korc M. Acute pancreatitis markedly accelerates pancreatic cancer progression in mice expressing oncogenic Kras. Biochem Biophys Res Commun 2009 - PMC - PubMed
    1. Castro AF, Rebhun JF, Quilliam LA. Measuring Ras-family GTP levels in vivo--running hot and cold. Methods. 2005;37:190–196. - PubMed

Publication types

MeSH terms