. 2012 Sep 11;22(3):331-44.
doi: 10.1016/j.ccr.2012.07.015.

Control of tumor bioenergetics and survival stress signaling by mitochondrial HSP90s

Affiliations

Control of tumor bioenergetics and survival stress signaling by mitochondrial HSP90s

Young Chan Chae et al. Cancer Cell. .

Abstract

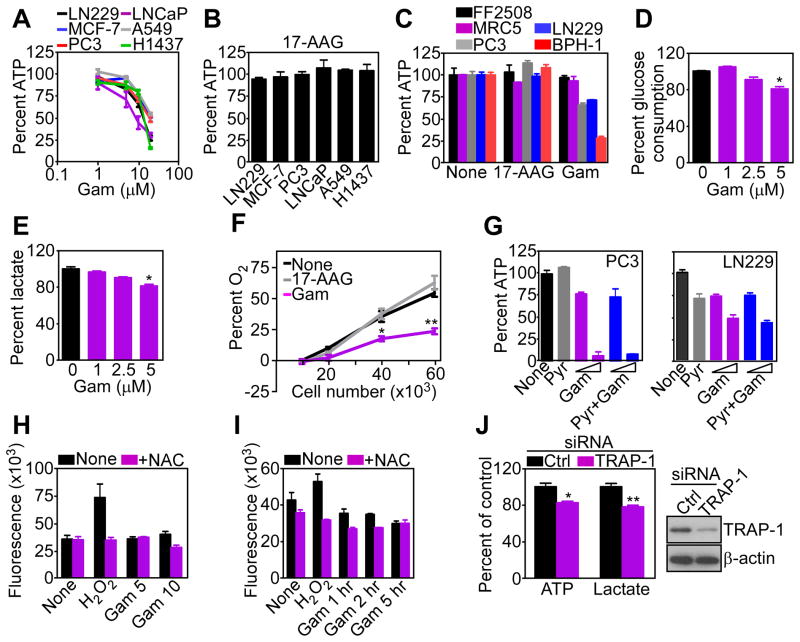
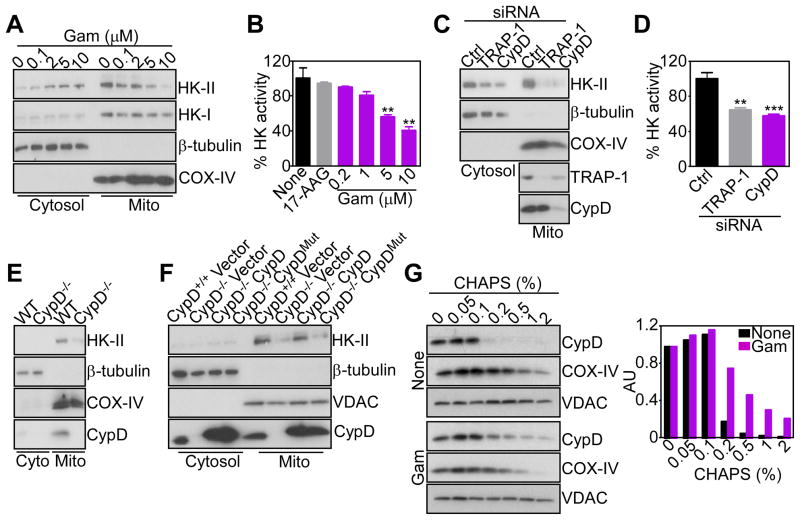
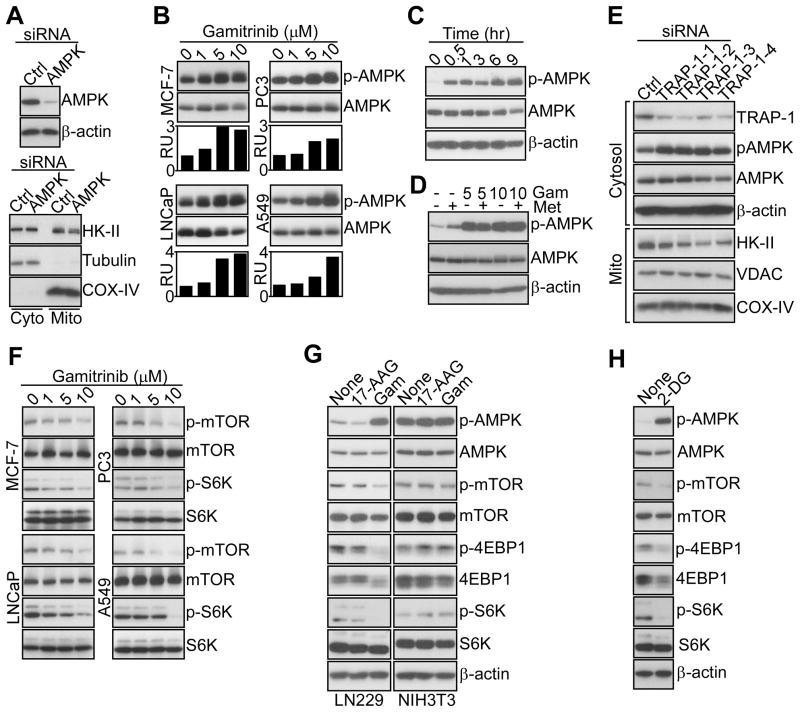
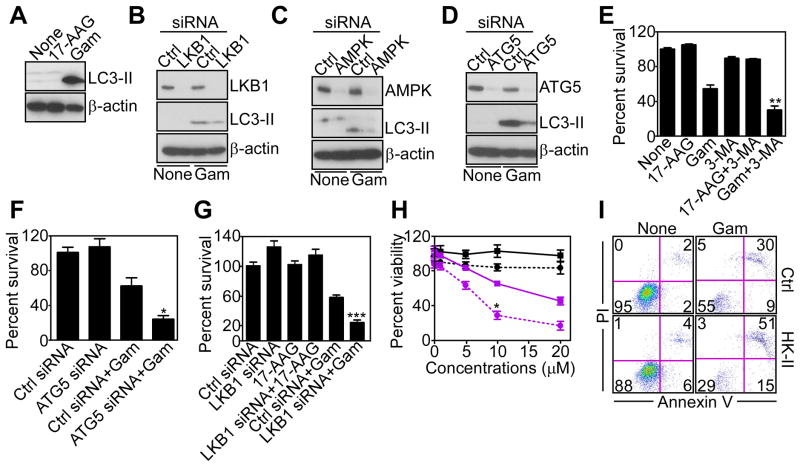
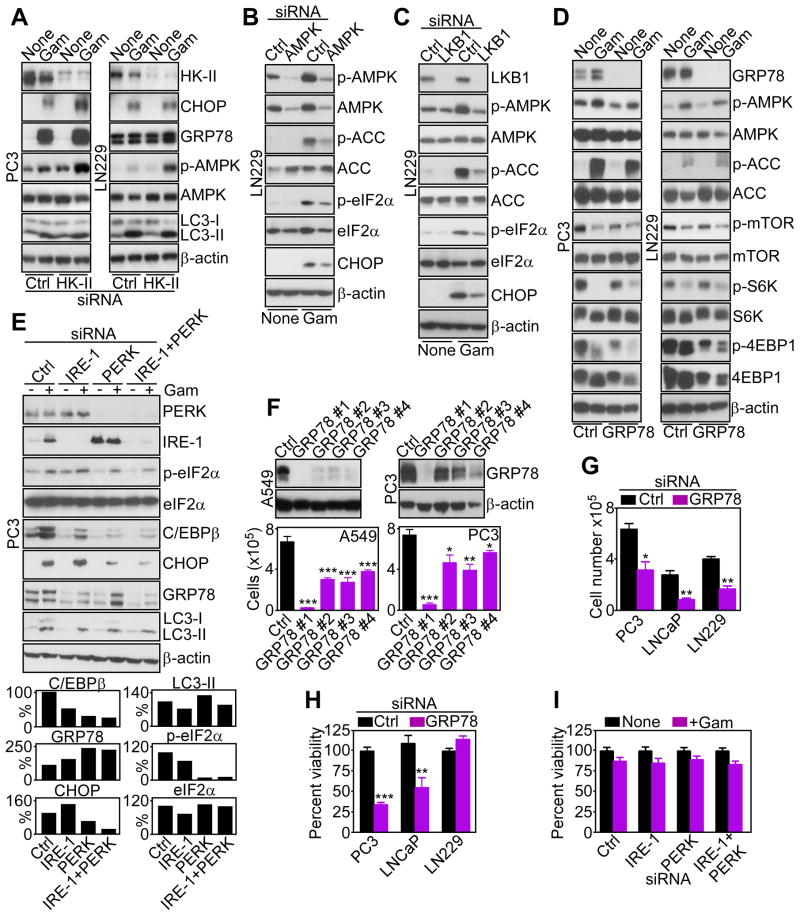
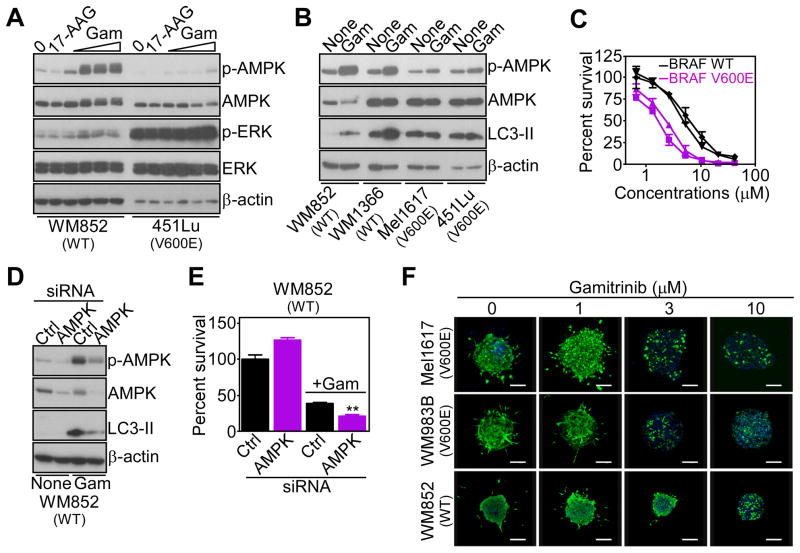
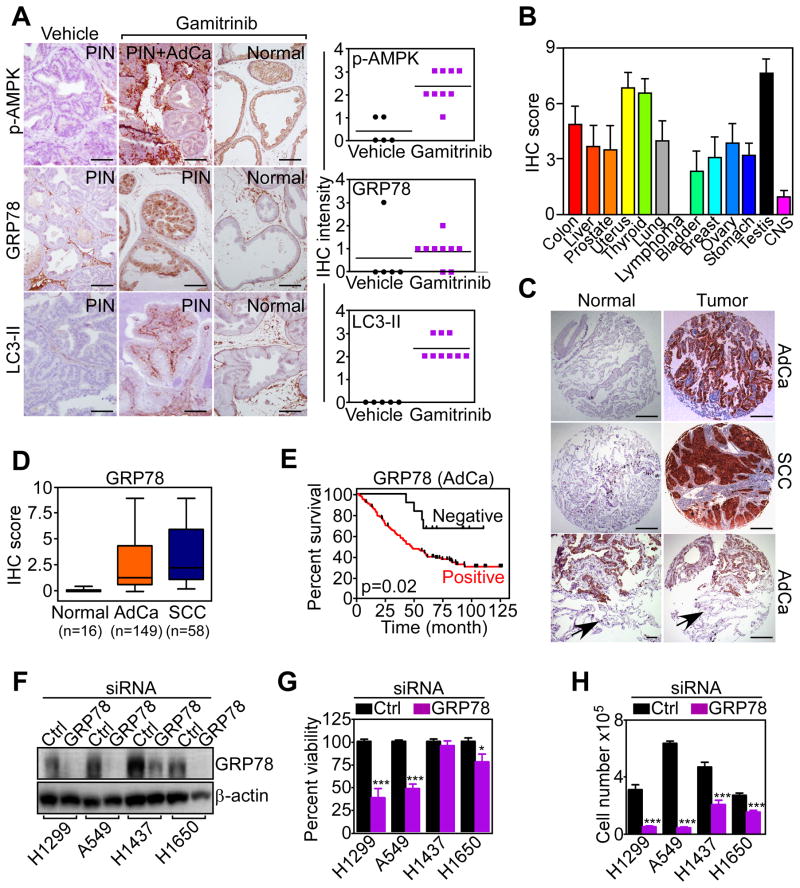
Tumors successfully adapt to constantly changing intra- and extracellular environments, but the wirings of this process are still largely elusive. Here, we show that heat-shock-protein-90-directed protein folding in mitochondria, but not cytosol, maintains energy production in tumor cells. Interference with this process activates a signaling network that involves phosphorylation of nutrient-sensing AMP-activated kinase, inhibition of rapamycin-sensitive mTOR complex 1, induction of autophagy, and expression of an endoplasmic reticulum unfolded protein response. This signaling network confers a survival and proliferative advantage to genetically disparate tumors, and correlates with worse outcome in lung cancer patients. Therefore, mitochondrial heat shock protein 90s are adaptive regulators of tumor bioenergetics and tractable targets for cancer therapy.


Conflict of interest statement

COMPETING FINANCIAL INTEREST

The authors declare no competing financial interest.

Figures

Figure 1
Figure 1. Mitochondrial HSP90 regulation of tumor bioenergetics
(A) Breast (MCF-7), prostate (PC3, LNCaP), lung (A549, H1473) or brain (glioblastoma, LN229) tumor cell lines were treated with the indicated concentrations of Gamitrinib (Gam) for 5 hr and analyzed for ATP production. Mean±SEM (n=3). (B) The indicated tumor cell lines were treated with 17-AAG (20 μM) for 5 hr and analyzed for ATP production. Mean±SEM (n=3). (C) The indicated normal (FF2508, MRC5) or tumor (LN229, PC3, BPH-1) cell lines were incubated with 17-AAG or Gamitrinib (10 μM) for 5 hr and analyzed for ATP production. Mean±SEM (n=3). (D, E) LN229 cells were treated with the indicated concentrations of Gamitrinib for 5 hr and analyzed for glucose consumption (D) or extracellular lactate content (E). Mean±SEM (n=3); *, p=0.015–0.022. (F) LN229 cells were plated at the indicated number, treated with vehicle, Gamitrinib or 17-AAG (5 μM) and analyzed for O2 consumption by a fluorimetric assay. Mean±SEM (n=3), *, p=0.019; **, p=0.001. (G) PC3 or LN229 cells were incubated with sodium pyruvate (Pyr, 1 mM) in the presence (5, 10 μM) or absence (None) of Gamitrinib for 7 hr and analyzed for ATP production. Mean±SD of replicates (n=2). (H) LN229 cells were labeled with the fluorescent dye H2-DCFA (6 μM), treated with Gamitrinib (5–10 μM), and analyzed for changes in fluorescence expression in a luminometer, with or without the antioxidant N-acetyl-L-cysteine (10 mM, NAC). H2O2 (5 mM) was used as control. Mean±SEM (n=4). (I) H2-DCFA-labeled LN229 cells were treated with 10 μM Gamitrinib for the indicated time intervals and analyzed for changes in ROS production at the indicated time intervals with or without NAC. H2O2 was a control. Mean±SEM (n=3). (J) LN229 transfected with control (Ctrl) or TRAP-1-directed siRNA were analyzed for changes in ATP production or extracellular lactate content (left) or TRAP-1 protein level (right). Mean±SEM (n=3); *, p=0.017; **, p=0.005. See also Figure S1.
Figure 2
Figure 2. Mitochondrial HSP90s control of CypD folding and HK-II recruitment
(A) LN229 cells were treated with Gamitrinib (Gam) and cytosolic or mitochondrial (Mito) fractions were analyzed after 5 hr by Western blotting. COX-IV was a mitochondrial marker. (B) LN229 cells were treated with 17-AAG (10 μM) or Gamitrinib, and mitochondrial fractions were analyzed for hexokinase activity after 5 hr. Mean±SD (n=2); **, p=0.005–0.004. (C) LN229 cells were transfected with control (Ctrl) or CypD- or TRAP-1-directed siRNA, and isolated mitochondrial (Mito) or cytosol fractions were analyzed after 48 hr by Western blotting. (D) Mitochondrial fractions from LN229 cells transfected as in (C) were analyzed for hexokinase activity after 48 hr. Mean±SD (n=2); ***, p=0.0009; **, p=0.0024. (E) Mitochondrial (Mito) or cytosol (Cyto) fractions from WT (CypD+/+) or CypD−/− MEFs were analyzed by Western blotting. (F) CypD+/+, CypD−/− or CypD−/− MEFs reconstituted with WT or PPIase-defective H168Q mutant CypD cDNA were fractionated in cytosol or mitochondrial (Mito) extracts, and analyzed by Western blotting. (G) LN229 cells were left untreated (None) or incubated with Gamitrinib (5 μM), mixed with the indicated increasing concentrations of CHAPS, and detergent-insoluble proteins were analyzed by Western blotting. Bar graph: densitometric quantification of protein bands. RU, relative units.
Figure 3
Figure 3. Modulation of AMPK and mTORC1 signaling by mitochondrial HSP90s
(A) LN229 cells were transfected with control (Ctrl) or AMPK-directed siRNA, and total cell extracts (top) or isolated cytosol (Cyto) or mitochondrial (Mito) fractions (bottom) were analyzed by Western blotting. (B) The various tumor cell lines were treated with the indicated concentrations of Gamitrinib, and analyzed by Western blotting after 5 hr. Bar graphs, densitometric quantification of protein bands. RU, relative units. (C) Gamitrinib-treated (10 μM) LN229 cells were analyzed at the indicated time intervals by Western blotting. (D) LN229 cells were treated with metformin (Met, 5 mM) in the presence or absence Gamitrinib (Gam, 5–10 μM), and analyzed after 12 hr by Western blotting. (E) LN229 cells were transfected with control (Ctrl) or the indicated individual siRNA sequences against TRAP-1 and isolated cytosol or mitochondrial (Mito) fractions were analyzed by Western blotting. (F) The indicated tumor cell types were treated with increasing concentrations of Gamitrinib and analyzed after 12 hr by Western blotting. (G) Tumor (LN229) or normal (NIH3T3) cell types were treated with Gamitrinib or 17-AAG (10 μM), and analyzed after 12 hr by Western blotting. (H) LN229 cells were treated with 2-DG (25 mM) and analyzed after 12 hr by Western blotting. See also Figure S2.
Figure 4
Figure 4. Mitochondrial proteotoxic stress stimulates autophagy
(A) LN229 cells treated with Gamitrinib or 17-AAG (10 μM) for 12 hr were analyzed by Western blotting. (B–D) LN229 cells were transfected with control (Ctrl), LKB1 (B)-, AMPK (C)-, or ATG5 (D)-directed siRNA, treated with vehicle or Gamitrinib (10 μM), and analyzed after 48 hr by Western blotting. (E) LN229 cells were treated with the inhibitor of phagosome formation, 3-MA, treated with Gamitrinib or 17-AAG (10 μM), and analyzed for cell viability by MTT. Mean±SD (n=2); **, p=0.0072. (F, G) LN229 cells were transfected with control siRNA (Ctrl) or transfected with ATG5 (F)- or LKB1 (G)-directed siRNA, incubated with 17-AAG (G) or Gamitrinib (10 μM), and analyzed for cell viability by MTT. Mean±SEM (n=4). *, p=0.02; ***, p<0.0004. (H) LN229 cells were transfected with control (squares) or HK-II (circles)-directed siRNA, treated with increasing concentrations of 17-AAG (black) or Gamitrinib (purple) and analyzed after 12 hr for cell viability by MTT. Mean±SD (n=2); *, p=0.02. (I) LN229 cells were transfected with control (Ctrl) or HK-II-directed siRNA, treated with vehicle (None) or Gamitrinib and analyzed for Annexin V and propidium iodide (PI) staining by multiparametric flow cytometry. The percentage of cells in each quadrant is indicated. See also Figure S3.
Figure 5
Figure 5. Regulation of ER UPR by mitochondrial HSP90s
(A) PC3 cells were incubated with Gamitrinib (5 μM) and analyzed at the indicated time intervals by Western blotting. (B) Gamitrinib-treated tumor cells were harvested at the indicated time intervals, and total RNA was amplified with primers to detect spliced (s) or unspliced (u) XBP1 mRNA transcripts. GAPDH was used as a control. (C) LNCaP cells were treated with Gamitrinib, and analyzed at the indicated time intervals by Western blotting. (D) Gamitrinib-treated LNCaP cells were harvested at the indicated time intervals, and analyzed for changes in CHOP, C/EBPβ or GRP78 mRNA expression, by quantitative PCR. Mean±SEM of replicates of a representative experiment (n=3). (E) Schematic diagram of ER stress luciferase-promoter reporter constructs used in this study. (F) PC3 cells were transfected with the indicated luciferase-promoter reporter constructs, or a CHOP minimal promoter upstream of a luciferase gene, incubated with Gamitrinib (5 μM), tunicamycin (Tun, 2.5 μg/ml) or 2-DG (25 mM) and analyzed for changes in luciferase expression in a luminometer after 20 hr. Mean±SEM (n=4). None, untreated. (G) PC3 cells were treated in the presence (+) or absence (−) of the mitochondrial uncoupler, CCCP, and analyzed after 6 or 16 hr by Western blotting. (H) The indicated tumor cell types were incubated without (None) or with 5 μM Gamitrinib in the presence or absence of the indicated concentrations of NAC (20 or 50 μM), and analyzed after 6 hr by Western blotting. (I) LN229 cells were cultivated in the presence of the indicated increasing concentrations of glucose-containing medium without (None) or with Gamitrinib (5 μM), and analyzed by Western blotting. (J) LN229 cells were treated with the indicated concentrations of Gamitrinib in the presence (+) or absence (−) of sodium pyruvate (Pyr, 1 mM), and analyzed after 7 hr by Western blotting. See also Figure S4.
Figure 6
Figure 6. Functional requirements of ER UPR induced by mitochondrial proteotoxic stress
(A-E) The indicated tumor cell lines were transfected with control siRNA (Ctrl), or siRNA directed to HK-II (A), AMPK (B), LKB1 (C), GRP78 (D), or the ER stress sensors IRE-1 or PERK, alone or in combination (E), incubated in the presence or absence (None) of Gamitrinib (5 μM) and analyzed 24–48 hr after siRNA transfection by Western blotting. Bar graphs (E), densitometric quantification of normalized C/EBPβ, CHOP, GRP78, LC3-II, or phosphorylated eIF2α bands in the presence of Gamitrinib. Basal eIF2α levels in the absence of Gamitrinib were also calculated. (F) A549 or PC3 cells were transfected with control siRNA (Ctrl) or the indicated individual siRNA sequences to GRP78, and analyzed after 48 hr by Western blotting. Bottom, siRNA-transfected cells as above were analyzed for cell proliferation by direct cell counting. Mean±SEM of three independent experiments. *, p<0.05; **, p<0.01; ***, p<0.001. (G, H) The indicated tumor cell types were transfected with control siRNA (Ctrl) or GRP78-directed siRNA, and analyzed for cell proliferation by direct cell counting (G), or cell viability by MTT (H). Mean±SEM (n=8, G; n=3, H); *, p=0.016; **, p=0.017–0.0055; ***, p<0.0001. (I) siRNA-transfected PC3 cells as in (E) were treated in the absence (None) or presence of 5 μM Gamitrinib and analyzed for cell viability by MTT. Mean±SEM of replicates of a representative experiment out of two independent determinations. See also Figure S5.
Figure 7
Figure 7. Regulation of tumor cell survival by mitochondrial proteotoxic stress
(A) WT or V600E mutant BRAF melanoma cell lines were treated with 17-AAG (10 μM) or Gamitrinib (1, 2.5, 5 or 10 μM) and analyzed after 5 hr by Western blotting. (B) The indicated melanoma cell types were incubated with Gamitrinib (5 μM) and analyzed after 9 hr by Western blotting. None, untreated. (C) WT (WM852, WM1366) or mutant BRAF (Me1617, 451Lu) melanoma cells were treated with Gamitrinib, and analyzed after 16 hr for cell viability by MTT. Mean±SD (n=2). (D) WM852 BRAF WT melanoma cells were transfected with control (Ctrl) or AMPK-directed siRNA, treated with Gamitrinib (5 μM), and analyzed by Western blotting. (E) WM852 melanoma cells transfected as in (D) were analyzed for Gamitrinib (10 μM)-mediated cell killing by MTT. Mean±SEM (n=3); **, p=0.002. (F) Melanoma cells with the indicated BRAF genotype were grown as organotypic spheroids in 3D collagen-embedded matrices, incubated with the indicated concentrations of Gamitrinib, stained after 72 hr with calcein-AM (live cells, green) and Topro-3 (dead cells, blue), and analyzed by confocal laser scanning microscopy. Representative images collected from one out of two independent determinations. See also Figure S6.
Figure 8
Figure 8. Activation of mitochondrial bioenergetics signaling during tumor progression, in vivo
(A) Prostate samples from TRAMP mice treated systemically with vehicle or Gamitrinib were analyzed by immunohistochemistry with antibodies to phosphorylated AMPK (p-AMPK), GRP78 or LC3-II. The histological diagnosis per each prostate tissue section is indicated. Right, quantification of staining intensity per each condition. Scale bars, 50 μm. (B) Expression of GRP78 in a universal tumor microarray was quantified by an immunohistochemistry (IHC) score. Each bar quantifies expression in the indicated tumor sites. CNS, central nervous system. Mean±SEM of IHC score in each individual TMA core (n=7). (C) Immunohistochemical reactivity of GRP78 expression in a representative NSCLC-TMA. Bottomimages, areas of normal lung parenchyma negative for GRP78 expression (arrows) adjacent to GRP78-positive lung cancer. Scale bars, 50 μm; 10 μm (bottom left image). (D) Summary of GRP78 expression in NSCLC or normal lung examined in this study. The number of cases per histologic condition is indicated. In this series, thirteen cases (6%) were not evaluable, and 17 cases (8%) were negative for GRP78 expression. Bars correspond to median expression values of IHC scores with interquartile range. AdCa, adenocarcinoma; SCC, squamous cell carcinoma. IHC, immunohistochemistry. The statistical analysis for GRP78 expression in the various cohorts (t test) is as follows: NSCLC versus normal, p=1.37×10⁻³²; AdCa versus normal, p=1.49×10⁻²¹; SCC versus normal, p=3.9×10⁻¹³; AdCa versus SCC, p=0.051. (E) Patients with diagnosis of lung adenocarcinoma (AdCa) with no expression (negative) or high expression (positive) of GRP78 were analyzed for overall survival by the Kaplan-Meier method. (F) The indicated lung adenocarcinoma cell types were transfected with control (Ctrl) or GRP78-directed siRNA and analyzed by Western blotting. (G, H) The indicated lung cancer cell lines were transfected as in (F), and analyzed for cell viability by MTT (G) or cell proliferation by direct cell counting (H). Mean±SEM (n=6). *, p=0.035; ***, p=0.0001–0.0002. See also Figure S7, Table S1.

References

    1. Baines CP, Kaiser RA, Purcell NH, Blair NS, Osinska H, Hambleton MA, Brunskill EW, Sayen MR, Gottlieb RA, Dorn GW, et al. Loss of cyclophilin D reveals a critical role for mitochondrial permeability transition in cell death. Nature. 2005;434:658–662. - PubMed
    1. Egan DF, Shackelford DB, Mihaylova MM, Gelino S, Kohnz RA, Mair W, Vasquez DS, Joshi A, Gwinn DM, Taylor R, et al. Phosphorylation of ULK1 (hATG1) by AMP-activated protein kinase connects energy sensing to mitophagy. Science. 2011;331:456–461. - PMC - PubMed
    1. Gandhi S, Wood-Kaczmar A, Yao Z, Plun-Favreau H, Deas E, Klupsch K, Downward J, Latchman DS, Tabrizi SJ, Wood NW, et al. PINK1-associated Parkinson’s disease is caused by neuronal vulnerability to calcium-induced cell death. Mol Cell. 2009;33:627–638. - PMC - PubMed
    1. Green DR, Kroemer G. The pathophysiology of mitochondrial cell death. Science. 2004;305:626–629. - PubMed
    1. Gwinn DM, Shackelford DB, Egan DF, Mihaylova MM, Mery A, Vasquez DS, Turk BE, Shaw RJ. AMPK phosphorylation of raptor mediates a metabolic checkpoint. Mol Cell. 2008;30:214–226. - PMC - PubMed

Publication types

MeSH terms

LinkOut - more resources