. 2012 Sep 11;22(3):359-72.
doi: 10.1016/j.ccr.2012.07.014.

Integrative analysis reveals an outcome-associated and targetable pattern of p53 and cell cycle deregulation in diffuse large B cell lymphoma

Affiliations

Integrative analysis reveals an outcome-associated and targetable pattern of p53 and cell cycle deregulation in diffuse large B cell lymphoma

Stefano Monti et al. Cancer Cell. .

Abstract

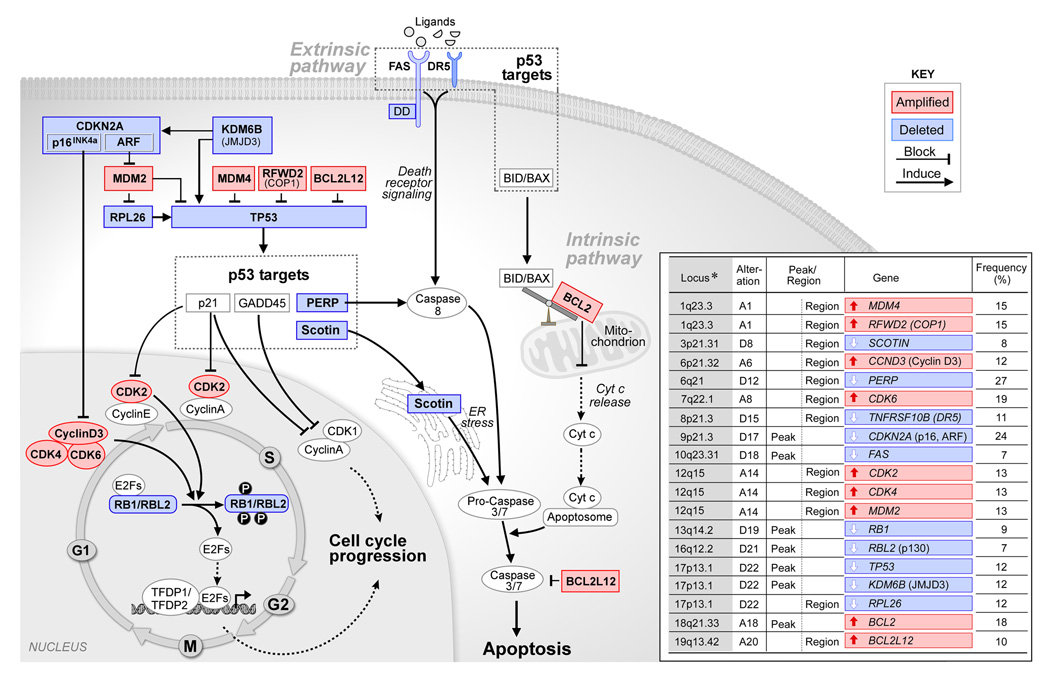
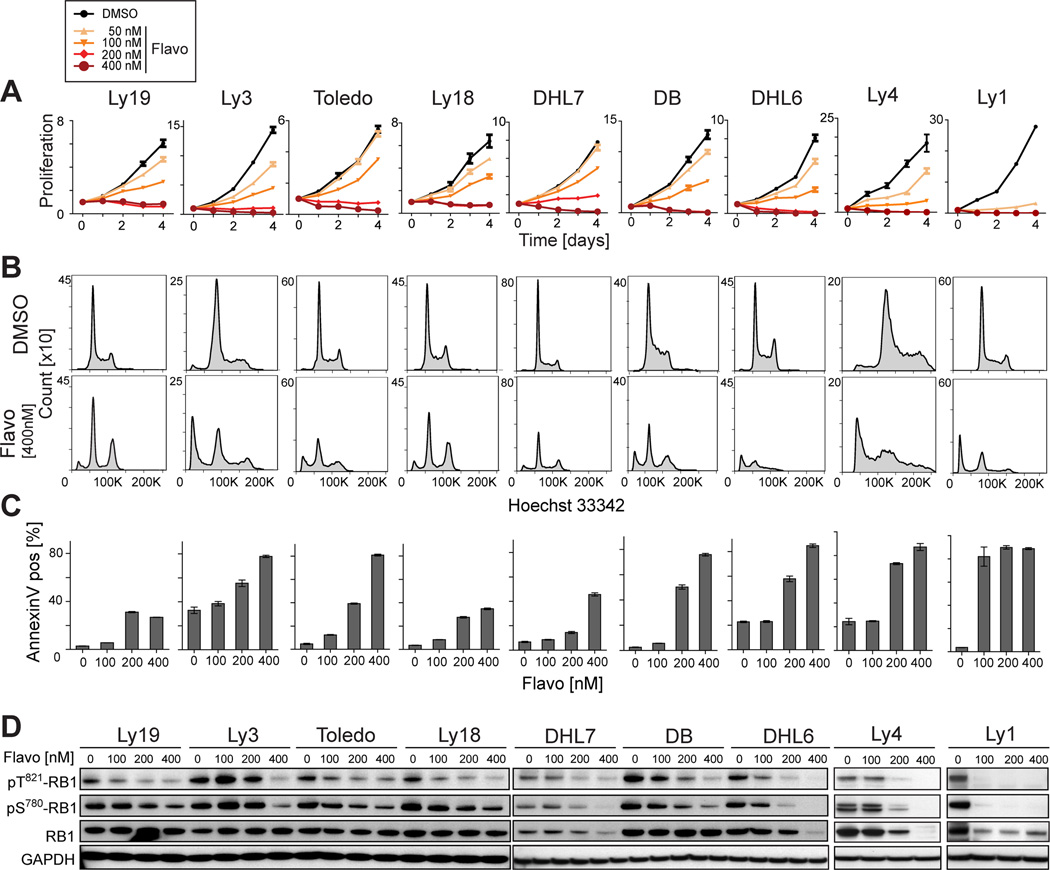
Diffuse large B cell lymphoma (DLBCL) is a clinically and biologically heterogeneous disease with a high proliferation rate. By integrating copy number data with transcriptional profiles and performing pathway analysis in primary DLBCLs, we identified a comprehensive set of copy number alterations (CNAs) that decreased p53 activity and perturbed cell cycle regulation. Primary tumors either had multiple complementary alterations of p53 and cell cycle components or largely lacked these lesions. DLBCLs with p53 and cell cycle pathway CNAs had decreased abundance of p53 target transcripts and increased expression of E2F target genes and the Ki67 proliferation marker. CNAs of the CDKN2A-TP53-RB-E2F axis provide a structural basis for increased proliferation in DLBCL, predict outcome with current therapy, and suggest targeted treatment approaches.


Figures

Figure 1
Figure 1. Recurrent CNAs in newly diagnosed DLBCLs
GISTIC summary plots of the significant CN gains (left panel, red) and CN losses (right panel, blue) in 180 primary DLBCLs are displayed by chromosomal position (y-axis). FDR q values < .25 (right of the green line, x-axis) are considered statistically significant. The chromosomal bands, GISTIC peak boundaries, frequencies of alterations (n [%]) and top 5 genes by integrative analyses of CN and transcript abundance are listed below. See also Tables S1, S2 and S3.
Figure 2
Figure 2. Comparison of CNAs in primary DLBCLs and non-hematologic cancers
The GISTIC-defined recurrent CNAs in the 180 primary DLBCLs (right) are compared to those in 2433 non-hematologic cancers from a publicly available database (left, (Beroukhim et al., 2010)) in a mirror plot with chromosome position on the Y-axis, significance (q value) on the X-axis, CN gain in red and CN loss in blue. Green line denotes FDR values < .25. See also Figure S1.
Figure 3
Figure 3. Pathway and transcription factor (TF) binding site enrichment
(A) Schema for pathway and TF binding site enrichment. (a) Pathway analysis. For each GISTIC peak and region, a “cis-acting gene signature” was defined which included the genes within a GISTIC alteration with a significant (FDR < .25) correlation between CN and gene expression (left panel). The global cis-acting signature – the union of all individual cis-acting signatures – was analyzed for pathway enrichment using a pathway compendium (C2, MSigDB). (b) TF binding site analysis schema. The “trans-acting signature” of each CNA (those genes outside the CNA with the most significant association between transcript abundance and the CNA) was defined (left panel) and the union of the cis- and trans-acting signatures was then tested for enrichment of genes with common TF binding sites using a TF binding site compendium (C3, MSigDB). (B) Pathway analysis. The results of global cis-acting signature pathway enrichment – separated for peaks (upper panel) and regions (lower panel) - were ranked by FDR (FDR ≤ .10, peaks; top set, region; amplified genes in red, deleted genes in blue). In the region pathway analysis, the set annotation is “out of 1893” instead of “out of 173”(**). (C) TF binding site analysis. The results were ranked by FDR (FDR ≤ .1 shown here). See also Table S4.
Figure 4
Figure 4. Components of the p53, apoptotic and cell cycle pathways perturbed by CNAs
Components include genes identified by the cis-signature pathway enrichment (Fig. 3B) and 3 recently described p53 modifiers and cis-signature genes, RPL26, KDM6B/JMJD3 and BCL2L12, that are not captured by the current annotated gene sets. Amplified genes, red; deleted genes, blue. For each CNA, the locus, peak or region gene and frequency of alteration are noted (right).
Figure 5
Figure 5. CNAs of p53 pathway and cell cycle components in individual primary DLBCLs and association with outcome
(A) Primary DLBCLs clustered in the space of CNAs that alter p53 pathway and cell cycle components. CNAs and perturbed genes on the left (rows) and individual tumors on top (columns). CN gains, red; CN losses, blue; color intensity corresponds to the magnitude of the CNA. Tumors with CNAs of multiple p53 pathway and cell cycle components, “complex”; DLBCLs without these lesions, “clean”. Total CNAs (Σ all CNAs) in “complex” vs. “clean” DLBCLs under heat map, p < .0001, Mann Whitney U test. TP53 mutations in “complex” vs. “clean” DLBCLs at top, 22% vs. 7%, p < 0.005, Fisher’s one-sided exact test. (B) GSEA of p53 targets in “clean” vs. “complex” DLBCLs. The 19K genes in the genome were sorted from highest (left, white) to lowest (right, grey) relative expression in “clean” vs. the “complex” DLBCLs (horizontal axis). The p53 targets (V.P53_02, described in Figure S2C) were located within the sorted genome and their positions (hits) were found to be significantly skewed toward the left end of the sorted list (positive enrichment score, 0.31), reflecting their statistically significant overexpression in “clean” as compared to “complex” DLBCLs (p = 0.01). (C) GSEA of a RB deficiency gene set in “complex” vs. “clean” DLBCLs. GSEA was performed as in (B) except that genes were sorted from highest to lowest expression in “complex” vs. “clean” DLBCLs (horizontal axis). The positions of RB-deficiency gene set members (hits) were significantly skewed toward the left end of the sorted list reflecting their overexpression in “complex” DLBCLs (positive enrichment score 0.79, p < 0.001). (D) Ki67 immunohistochemistry of “complex” and “clean” DLBCLs. (Left) Representative “clean” (upper micrographs) and “complex” DLBCLs (lower micrographs). Scale bar represents 50 µm. (Right) Percentage Ki67-positive tumor cells in “complex” and “clean” DLBCLs (p = 0.019, Mann Whitney U test) visualized as Box-Plot (median, line; 25% and 75% quartile, box; whiskers, minimum to maximum). See also Figure S2 and Table S5.
Figure 6
Figure 6. Prognostic significance of “complex” vs. “clean” CNA pattern in DLBCLs
(A) Overall survival of R-CHOP treated DLBCL patients with “complex” vs. “clean” CNA patterns (p = .001, log rank test). (B) CNA patterns in IPI risk groups. (Left) Overall survival of R-CHOP treated DLBCL patients in Low/Low-intermediate and High-intermediate/High IPI risk groups. (Middle and right) Overall survival of Low/Low-intermediate and High-intermediate/High risk patients with “complex” vs. “clean” CNA patterns. See also Figure S3, Tables S6 and S7.
Figure 7
Figure 7. Targeting deregulated cell cycle with a pan-CDK inhibitor
DLBCL cell lines with decreased or absent p53 activity and CNAs of CDKN2A, CCND3, CDK4, CDK6, CDK2 and/or copy loss of RB1 were treated with the pan-CDK inhibitor, flavopiridol, which blocks CDKs 4/6, 2 and 1 (and CDK9). (A) Proliferation following flavopiridol treatment (50 nM – 400 nM) for 1–4 days. DLBCL cell lines names at top. (B) Cell cycle analysis following 72 hr flavopiridol treatment (400 nM) (DMSO control). (C) Apoptosis (Annexin V staining) following 72 hr flavopiridol treatment (100 – 400 nM). (D) RB1 phosphorylation at CDK4/6 and CDK2-specific sites (pS870 and pT821, respectively) following 24 hr flavopiridol treatment (100 – 400 nM). (Note that Rb is itself an E2F target (Knudsen and Knudsen, 2008)). Error bars show the SD of triplicates. See also Figure S4.
Figure 8
Figure 8. In vivo efficacy of a pan-CDK inhibitor in DLBCL xenografts
(A) Bioluminescense of flavopiridol- or vehicle-treated NSG mice xenotransplanted with luciferized mCherry+ (Toledo, Ly4 or Ly1) DLBCL cells. Error bars show the SEM. (B) Lymphoma infiltration in the bone marrow of NSG mice (in A) following flavopiridol or vehicle treatment. Single cell suspensions of bone marrow of tumor-bearing mice were evaluated for mCherry+ DLBCL cells by flow cytometry and visualized as Box-Plot (median, line; 25% and 75% quartile, box; whiskers, minimum to maximum). P values are obtained with a Mann Whitney U test. (C) Immunohistochemical analysis of lymphoma (Toledo) cell infiltration in spleens of vehicle- and flavopiridol-treated mice: H & E; Anti-human CD20, and anti-Ki67 immunostaining. Scale bar represents 50 µm. See also Figure S5.

References

    1. Agger K, Cloos PAC, Rudkjaer L, Williams K, Andersen G, Christensen J, Helin K. The H3K27 me3 demethylase JMJD3 contributes to the activation of the INK4A-ARF locus in response to oncogene- and stress-induced senescence. Genes Dev. 2009;23:1171–1176. - PMC - PubMed
    1. Bea S, Zetti A, Wright G, Salaverria I, Jehn P, Moreno VCB, Ott G, Xavier P, Yang L, et al. Diffuse large B-cell lymphoma subgroups have distinct genetic profiles that influence tumor biology and improve gene-expression-based survival prediction. Blood. 2005;106:3183–3190. - PMC - PubMed
    1. Beaudry VG, Jiang D, Dusek RL, Park EJ, Knezevich S, Ridd K, Vogel H, Bastian BC, Attardi LD. Loss of the p53/p63 regulated desmosomal protein Perp promotes tumorigenesis. PloS Genetics. 2010;6:e1001168. - PMC - PubMed
    1. Bernal F, Wade M, Godes M, Davis TN, Whitehead DG, Kung AL, Wahl GM, Walensky LD. A stapled p53 helix overcomes HDMX-mediated suppression of p53. Cancer Cell. 2010 - PMC - PubMed
    1. Beroukhim R, Getz G, Nghiemphu L, Barretina J, Hsueh T, Linhart D, Vivanco I, Lee JC, Huang JH, Alexander S, et al. Assessing the significance of chromosomal aberrations in cancer: methodology and application in glioma. Proc Natl Acad Sci U S A. 2007;104:20007–20012. - PMC - PubMed

Publication types

MeSH terms

Substances