. 2012 Oct;135(Pt 10):3089-100.
doi: 10.1093/brain/aws220. Epub 2012 Sep 13.

Single-subject oscillatory γ responses in tinnitus

Affiliations

Single-subject oscillatory γ responses in tinnitus

William Sedley et al. Brain. 2012 Oct.

Abstract

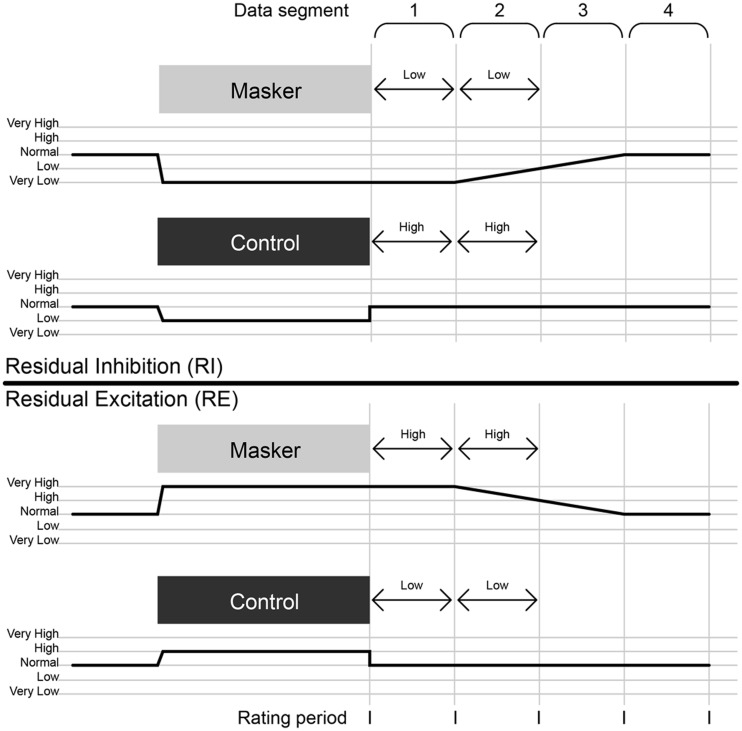
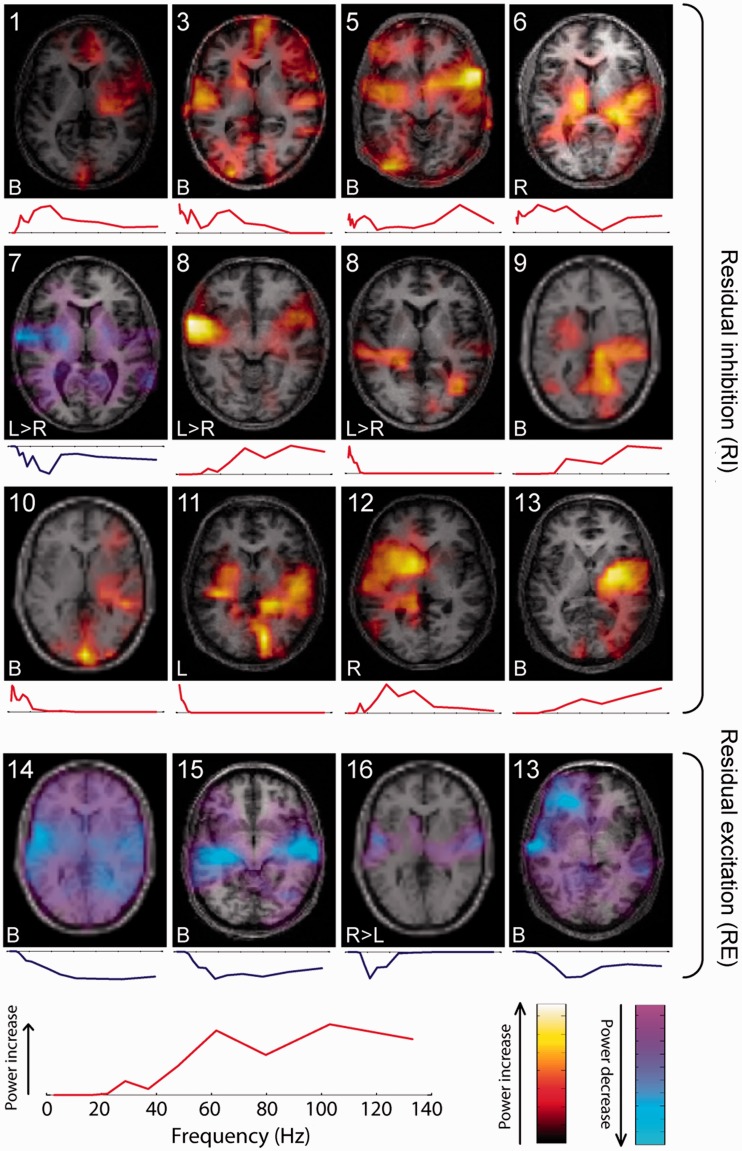
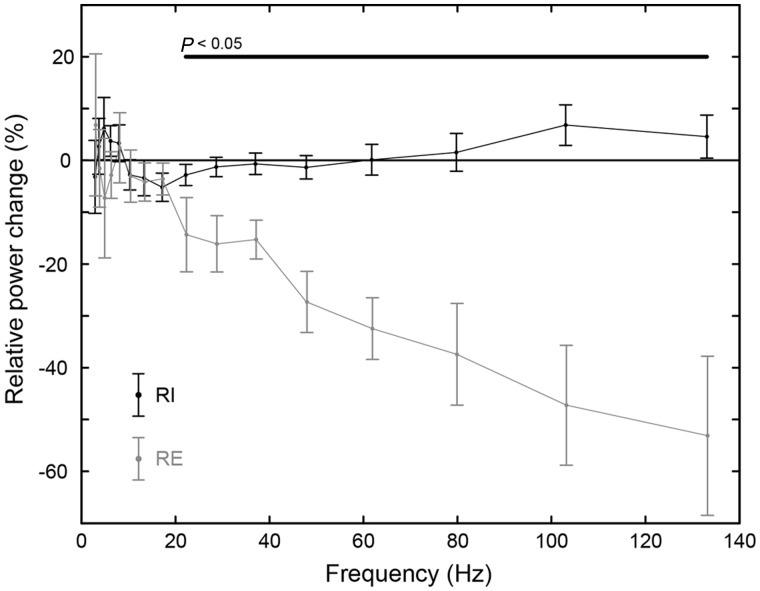
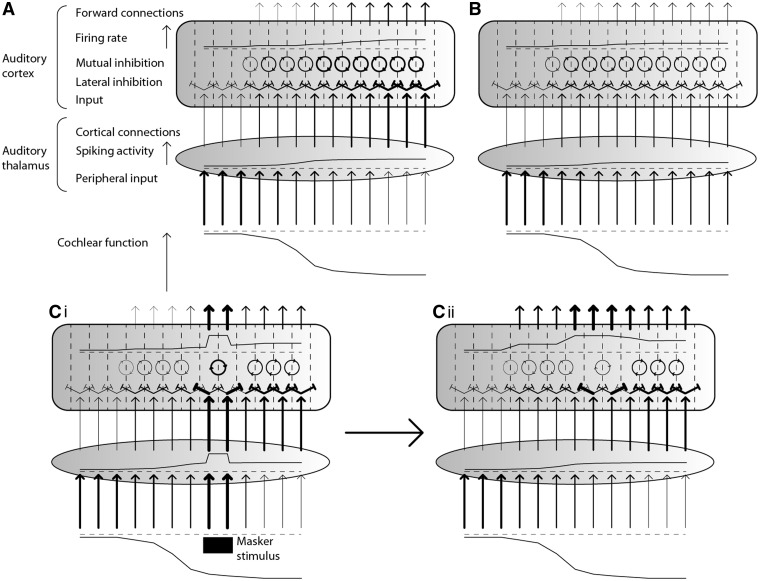
This study used magnetoencephalography to record oscillatory activity in a group of 17 patients with chronic tinnitus. Two methods, residual inhibition and residual excitation, were used to bring about transient changes in spontaneous tinnitus intensity in order to measure dynamic tinnitus correlates in individual patients. In residual inhibition, a positive correlation was seen between tinnitus intensity and both delta/theta (6/14 patients) and gamma band (8/14 patients) oscillations in auditory cortex, suggesting an increased thalamocortical input and cortical gamma response, respectively, associated with higher tinnitus states. Conversely, 4/4 patients exhibiting residual excitation demonstrated an inverse correlation between perceived tinnitus intensity and auditory cortex gamma oscillations (with no delta/theta changes) that cannot be explained by existing models. Significant oscillatory power changes were also identified in a variety of cortical regions, most commonly midline lobar regions in the default mode network, cerebellum, insula and anterior temporal lobe. These were highly variable across patients in terms of areas and frequency bands involved, and in direction of power change. We suggest a model based on a local circuit function of cortical gamma-band oscillations as a process of mutual inhibition that might suppress abnormal cortical activity in tinnitus. The work implicates auditory cortex gamma-band oscillations as a fundamental intrinsic mechanism for attenuating phantom auditory perception.


Figures

Figure 1
Figure 1
Example schematic of residual inhibition and residual excitation paradigms. In each half, the upper section shows the active (masker) condition and the lower section the control condition. The horizontal axis represents time, the shaded rectangles the auditory stimuli, the numbered brackets the data segments potentially used for analysis, the continuous black lines the intensity of tinnitus and the short vertical lines the instances where the patient rates their tinnitus intensity. The arrowed lines indicate the data segments used for further analysis in these examples and the categories to which they are assigned. Note that the ‘high’ and ‘low’ categories are relative, and paradigm-dependent, such that baseline tinnitus intensity is designated high and low in residual inhibition and residual excitation, respectively.
Figure 2
Figure 2
Clusters including power changes in auditory cortex. Each cluster’s spatial representation is displayed by showing a single representative axial slice at the level of the superior temporal plane. Each cluster is accompanied by the patient’s number (upper left) and tinnitus laterality (lower left), and its frequency spectrum is shown below the axial brain image. Red and yellow colours indicate power increases as a function of increased tinnitus intensity, and blue colours indicate power decreases as a function of increased tinnitus intensity. The upper 12 clusters represent residual inhibition, and the lower four clusters residual excitation. Bottom left: Plot showing one cluster’s frequency spectrum in greater detail to illustrate the frequency axis and highlight that the vertical axis indicates power change at each frequency (positive/red for power increases, negative/blue for decreases). The colour scales (bottom right) correspond to the power increases and decreases shown on the axial brain slices.
Figure 3
Figure 3
Power changes in auditory cortex at group level. Each hemisphere in each patient was treated as an individual subject. For each hemisphere, power was taken at the closest dipole to the posterior edge of the middle of Heschl’s gyrus. Relative power change was calculated, for each frequency, as 100(PhighPlow)/(Phigh + Plow). Points indicate the group mean and error bars indicate the standard error of the mean. The horizontal black bar denotes differences between groups significant at P < 0.05 uncorrected. RE = residual excitation; RI = residual inhibition.
Figure 4
Figure 4
Model of the cause and role of auditory cortex gamma oscillations in the suppression of tinnitus. A simplified schematic of the auditory pathway (A) in association with tinnitus, during silence (i.e. no external auditory stimuli), (B) in the context of residual inhibition after the masking stimulus has ended, (Ci) during residual excitation while the masking stimulus is still present, and (Cii) during residual excitation once the masking stimulus has ended. The horizontal axis (and greyscale gradient) indicate the part of the tonotopic axis of the auditory pathways. Vertical arrows indicate forward connections, with thickness denoting connection strength. Spiking activity in auditory thalamus is represented at each frequency by the height of the line shown. Lateral inhibition, between cortical tonotopic regions, is denoted by diagonal flat-ended arrows, with strength of inhibition denoted by line thickness. Mutual inhibition, in the form of cortical gamma oscillations, is denoted by arrowed circles within auditory cortex, with strength denoted by circle thickness and phase by the position of the arrows on the circles. Mean firing rate of cortical excitatory neurons is denoted by the height of the line shown. Arrows projecting from auditory cortex denote the strength of cortical efferent connections to higher cognitive and perceptual networks, with strength represented by arrow thickness.

References

    1. Ashton H, Reid K, Marsh R, Johnson I, Alter K, Griffiths T. High frequency ‘hot spots’ in temporal lobes of patients with intractable tinnitus: a quantitative electroencephalographic (QEEG) study. Neurosci Lett. 2007;426:23, 8. - PubMed
    1. Bartos M, Vida I, Jonas P. Synaptic mechanisms of synchronized gamma oscillations in inhibitory interneuron networks. Nat Rev Neurosci. 2007;8:45–56. - PubMed
    1. Bathellier B, Lagier S, Faure P, Lledo P-M. Circuit properties generating gamma oscillations in a network model of the olfactory bulb. J Neurophysiol. 2006;95:2678–91. - PubMed
    1. Börgers C, Epstein S, Kopell NJ. Gamma oscillations mediate stimulus competition and attentional selection in a cortical network model. Proc Natl Acad Sci USA. 2008;105:18023–8. - PMC - PubMed
    1. Candin J, Carlén M, Meletis K, Knoblich U, Zhang F, Deisseroth K, et al. Driving fast-spiking cells induces gamma rhythm and controls sensory responses. Nature. 2009;459:663–7. - PMC - PubMed

Publication types