Comparative Study
. 2013 May 20;32(11):1865-76.
doi: 10.1002/sim.5601. Epub 2012 Sep 13.

A simple decision analytic solution to the comparison of two binary diagnostic tests

Affiliations
Comparative Study

A simple decision analytic solution to the comparison of two binary diagnostic tests

Andrew J Vickers et al. Stat Med. .

Abstract

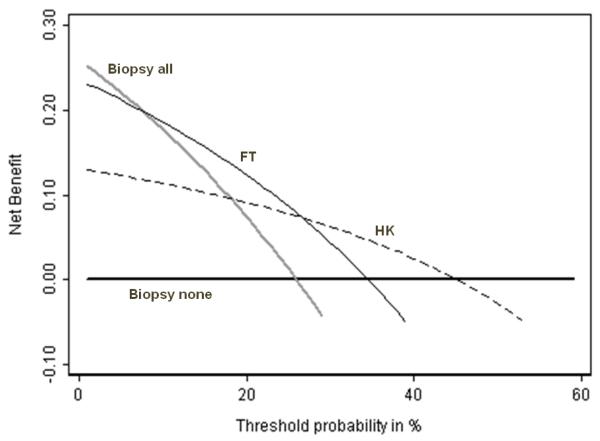
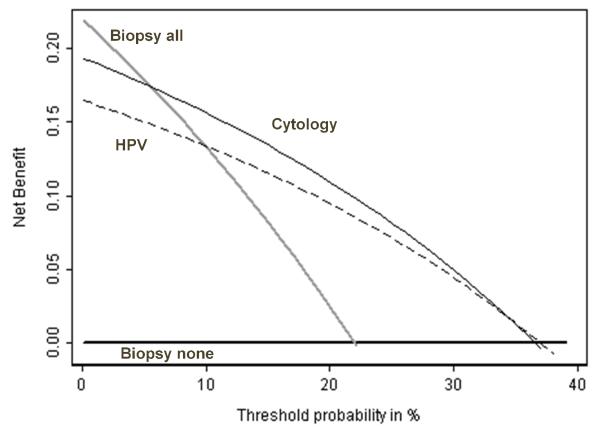
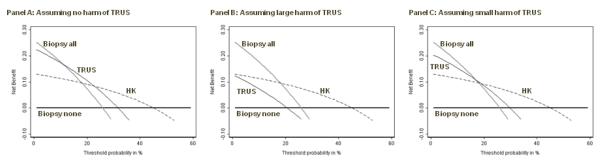
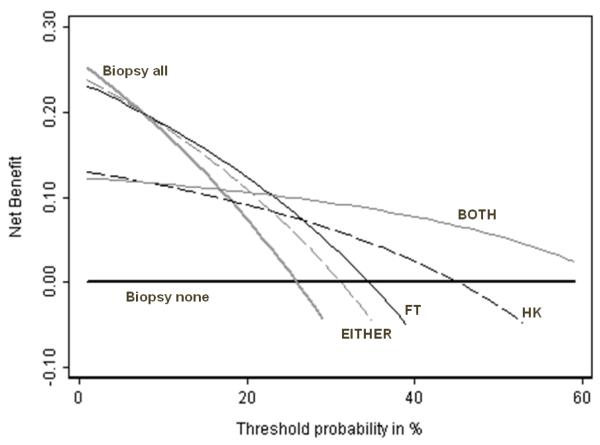
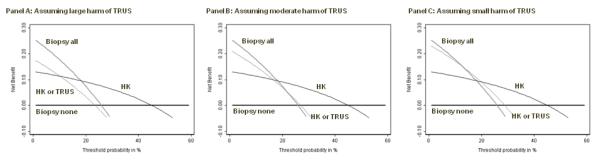
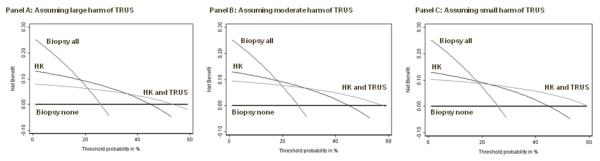
One of the most basic biostatistical problems is the comparison of two binary diagnostic tests. Commonly, one test will have greater sensitivity, and the other greater specificity. In this case, the choice of the optimal test generally requires a qualitative judgment as to whether gains in sensitivity are offset by losses in specificity. Here, we propose a simple decision analytic solution in which sensitivity and specificity are weighted by an intuitive parameter, the threshold probability of disease at which a patient will opt for treatment. This gives a net benefit that can be used to determine which of two diagnostic tests will give better clinical results at a given threshold probability and whether either is superior to the strategy of assuming that all or no patients have disease. We derive a simple formula for the relative diagnostic value, which is the difference in sensitivities of two tests divided by the difference in the specificities. We show that multiplying relative diagnostic value by the odds at the prevalence gives the odds of the threshold probability below which the more sensitive test is preferable and above which the more specific test should be chosen. The methodology is easily extended to incorporate combinations of tests and the risk or side effects of a test.


Figures

Figure 1
Figure 1. Net benefit against plotted against threshold probabilityfor molecular markers of prostate cancer
Grey line: biopsy all men. Thick black line: biopsy no men. Thin black line: biopsy if FT test positive. Dashed line: biopsy if HK test positive. The optimal strategy is to biopsy all men if the threshold probability is below 10%; biopsy on the basis of FT is threshold probability is 10 – 25%; biopsy by HK if threshold probability is 25 – 45% and biopsy no man if threshold probability is greater than 45%.
Figure 2
Figure 2. Net benefit against plotted against threshold probability for repeat tests for cervical abnormalities
Grey line: colposcopy for all women. Thick black line: colposcopy for no women. Thin black line: colposcopy if HPV test positive. Dashed line: colposcopy if repeat cytology positive. A repeat PAP smear is of value if the threshold probability for colposcopy is between 10 – 35%; there is no value to an HPV test.
Figure 3
Figure 3. Net benefit against plotted against threshold probabilityfor a molecular marker of prostate cancer compared to an invasive diagnostic test
Grey line: biopsy all men. Thin black line: biopsy no men. Dashed line: biopsy if HK test positive. Thick black line: biopsy if TRUS test positive, assuming no harm of TRUS (left panel); a physician would do not more than 10 TRUS to find one cancer (center panel); a physician would do no more than 50 TRUS to find one cancer (right panel). TRUS is of some benefit (left panel) unless one takes into account harm: even under the very liberal assumption that a physician would conduct 50 TRUS to find one cancer (right panel), TRUS has highest net benefit for no threshold probability.
Figure 4
Figure 4. Net benefit against plotted against threshold probability for molecular markers of prostate cancer
Thick grey line: biopsy all men. Thick black line: biopsy no men. Thin black line: biopsy if FT test positive. Dashed black line: biopsy if HK test positive. Thin grey line: biopsy if EITHER FT or HK positive. Dashed grey line: biopsy if BOTH HK and FT positive. The highest net benefit is for biopsying all men (threshold probability less than 10%); FT (threshold probability 10 – 25%) and BOTH (threshold probability 25% +). For no threshold probability do HK or EITHER have the highest net benefit, suggesting that neither HK alone nor a test of either HK or FT should be used.
Figure 5
Figure 5. Net benefit against plotted against threshold probability for a molecular marker of prostate cancer, with an invasive diagnostic test conditional upon the marker findings
Thick grey line: biopsy all men. Thick black line: biopsy no men. Thin black line: biopsy if HK test positive. Thin grey line: biopsy if HK test positive or TRUS following a negative HK test is positive, assuming a physician would do not more than 10 TRUS to find one cancer (left panel); a physician would do no more than 20 TRUS to find one cancer (center panel); a physician would do no more than 50 TRUS to find one cancer (right panel). Even if TRUS is considered of relatively little disbenefit, its use cannot be justified for what would appear to be the clinically sensible strategy of only applying TRUS where HK is negative.
Figure 6
Figure 6. Net benefit against plotted against threshold probability for a molecular marker of prostate cancer, with an invasive diagnostic test conditional upon the marker findings
Thick grey line: biopsy all men. Thick black line: biopsy no men. Thin black line: biopsy if HK test positive. Thin grey line: biopsy if HK test positive and a TRUS given after a positive HK test is also positive, assuming a physician would do not more than 10 TRUS to find one cancer (left panel); a physician would do no more than 20 TRUS to find one cancer (center panel); a physician would do no more than 50 TRUS to find one cancer (right panel).The conditional strategy is now found to be preferable for certain threshold probabilities.

Comment in

References

    1. Biggerstaff BJ. Comparing diagnostic tests: a simple graphic using likelihood ratios. Stat Med. 2000;19:649–663. DOI 10.1002/(SICI)1097-0258(20000315)19:5. - PubMed
    1. Macaskill P, Walter SD, Irwig L, Franco EL. Assessing the gain in diagnostic performance when combining two diagnostic tests. Stat Med. 2002;21:2527–2546. DOI 10.1002/sim.1227. - PubMed
    1. Bennett BM. On comparisons of sensitivity, specificity and predictive value of a number of diagnostic procedures. Biometrics. 1972;28:793–800. - PubMed
    1. Nofuentes JA, Del Castillo Jde D. Comparison of the likelihood ratios of two binary diagnostic tests in paired designs. Stat Med. 2007;26:4179–4201. DOI 10.1002/sim.2850 [doi] - PubMed
    1. Lu Y, Jin H, Genant HK. On the non-inferiority of a diagnostic test based on paired observations. Stat Med. 2003;22:3029–3044. DOI 10.1002/sim.1569. - PubMed

Publication types

Substances

LinkOut - more resources