. 2012 Dec;124(6):777-95.
doi: 10.1007/s00401-012-1038-9. Epub 2012 Sep 14.

Electrophysiological changes precede morphological changes to frontal cortical pyramidal neurons in the rTg4510 mouse model of progressive tauopathy

Affiliations

Electrophysiological changes precede morphological changes to frontal cortical pyramidal neurons in the rTg4510 mouse model of progressive tauopathy

Johanna L Crimins et al. Acta Neuropathol. 2012 Dec.

Abstract

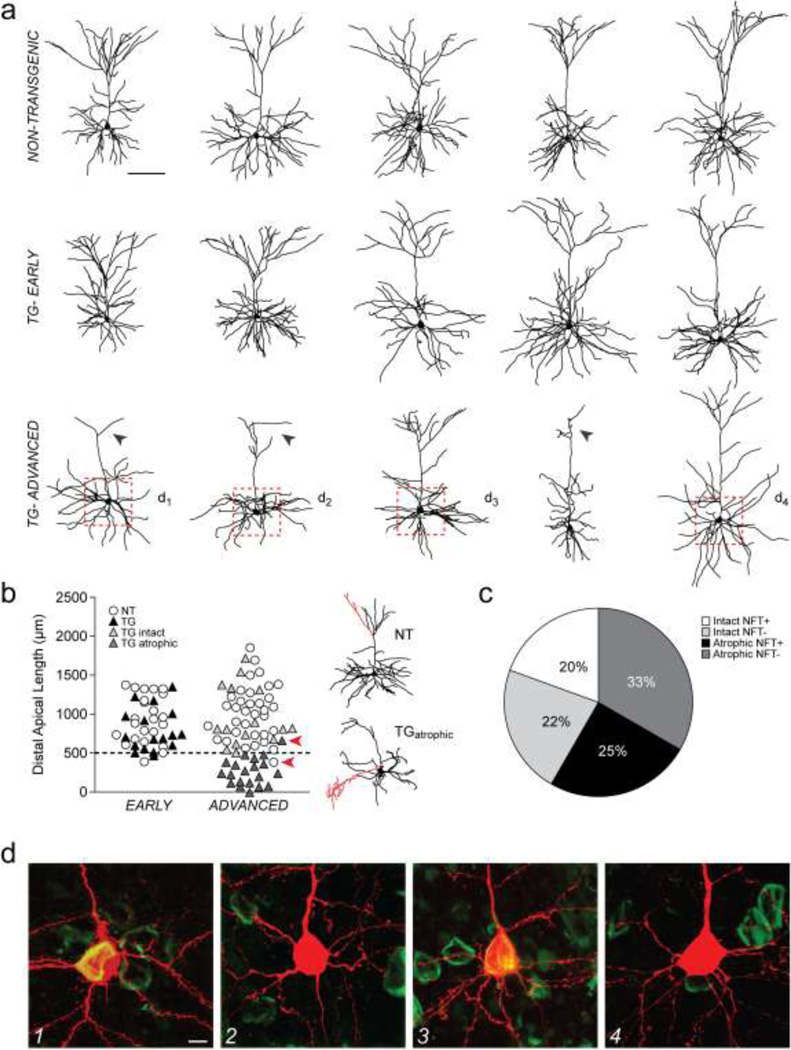
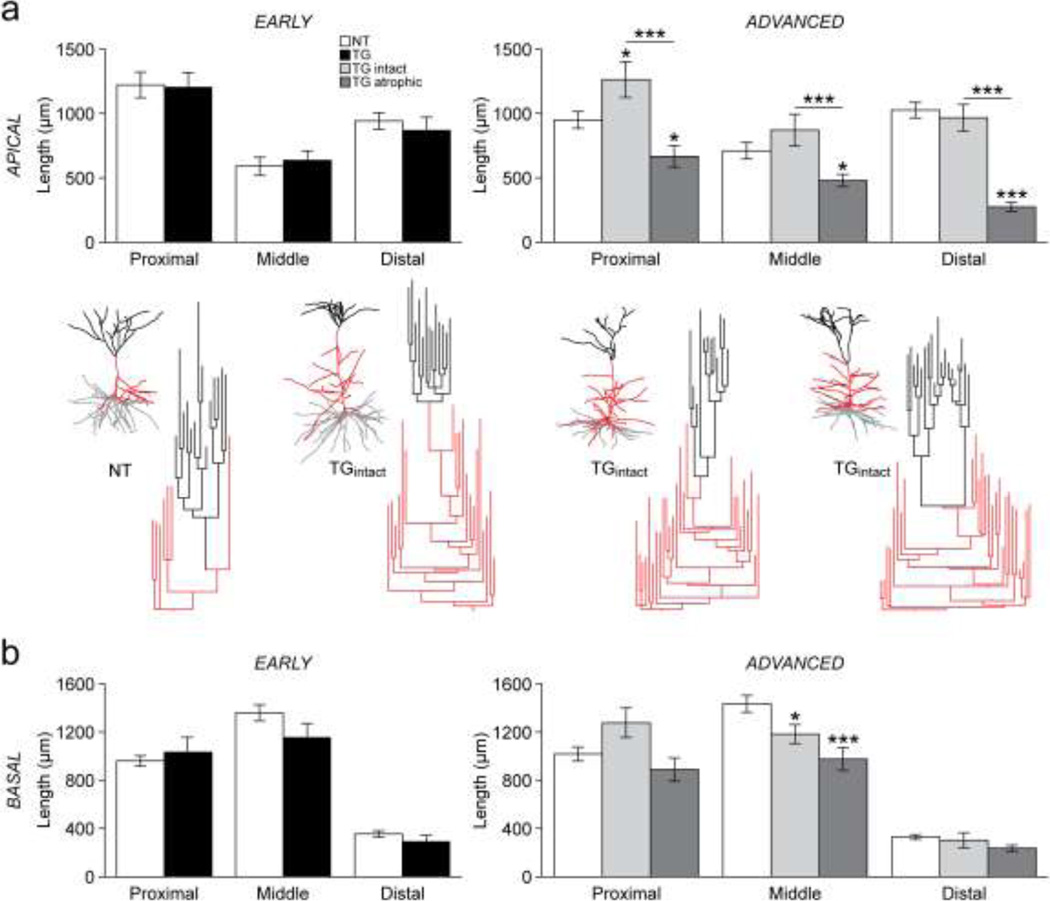
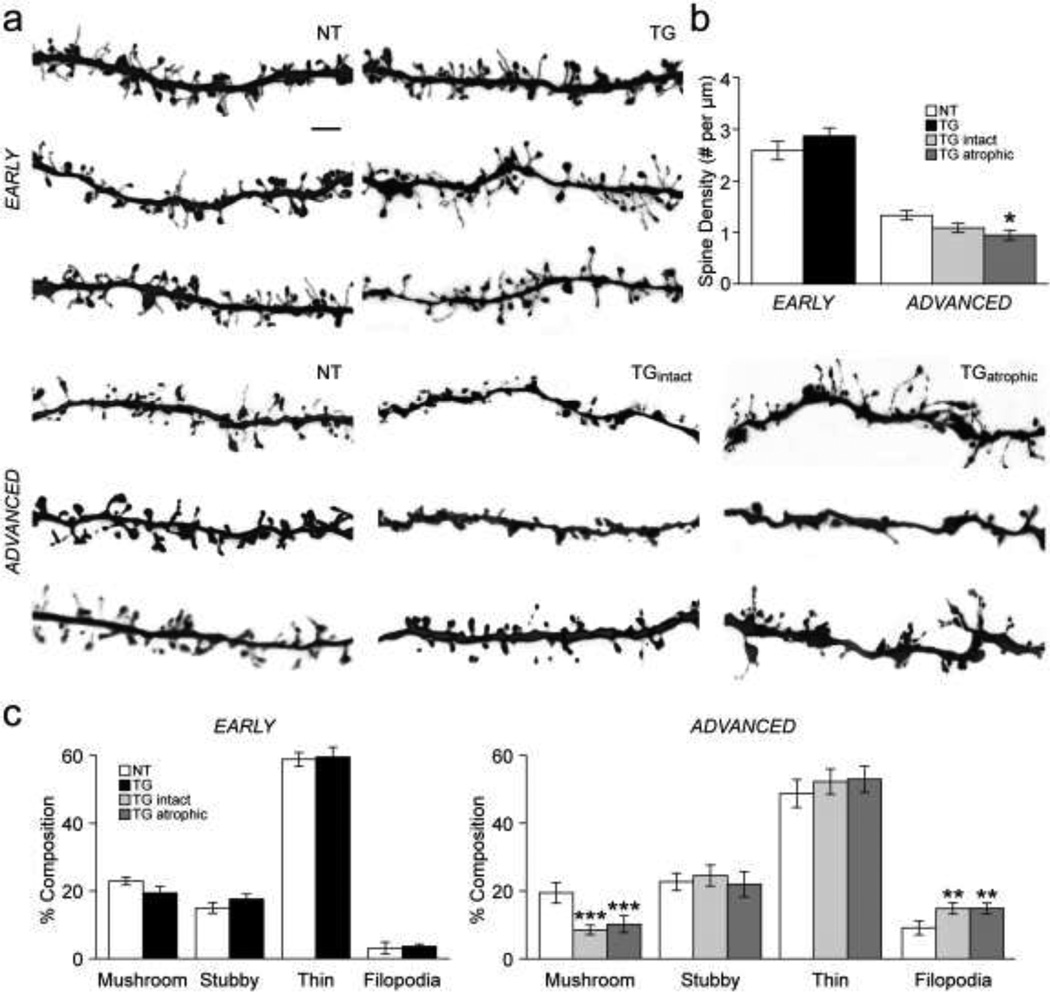
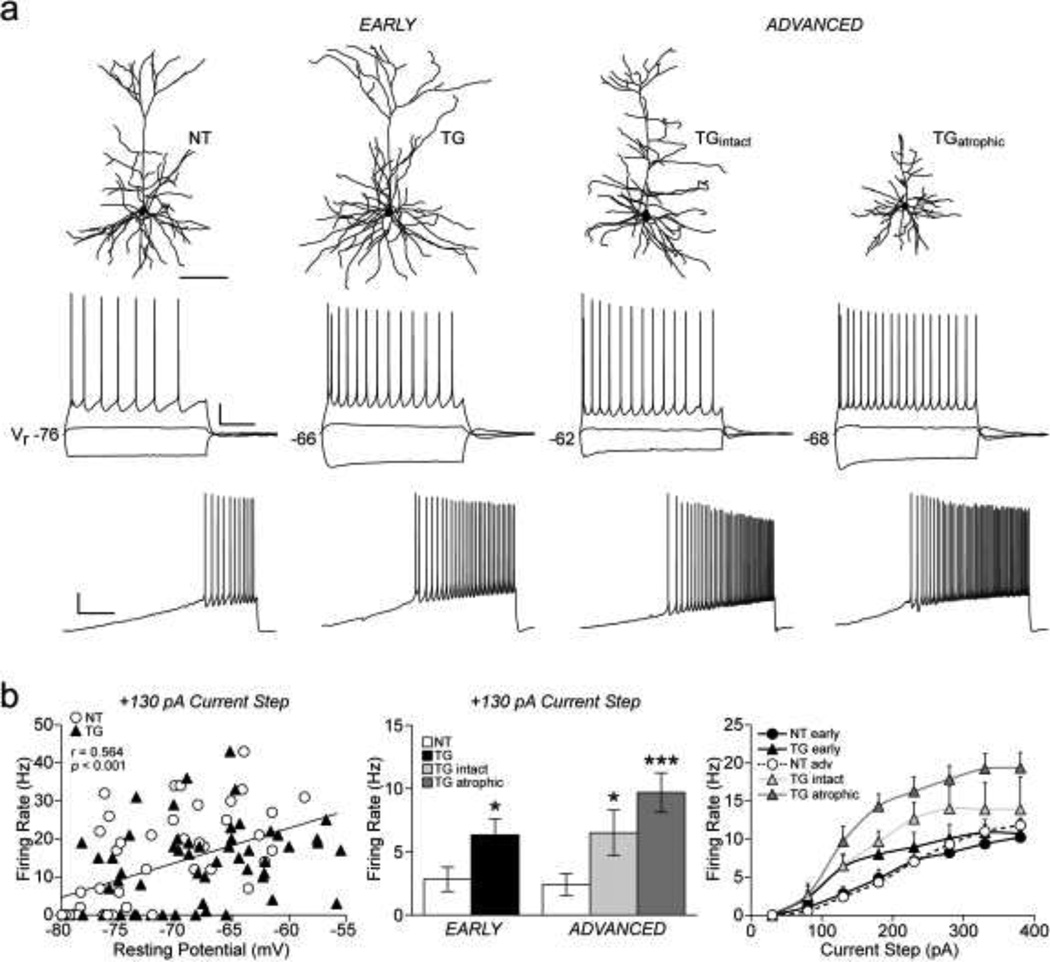
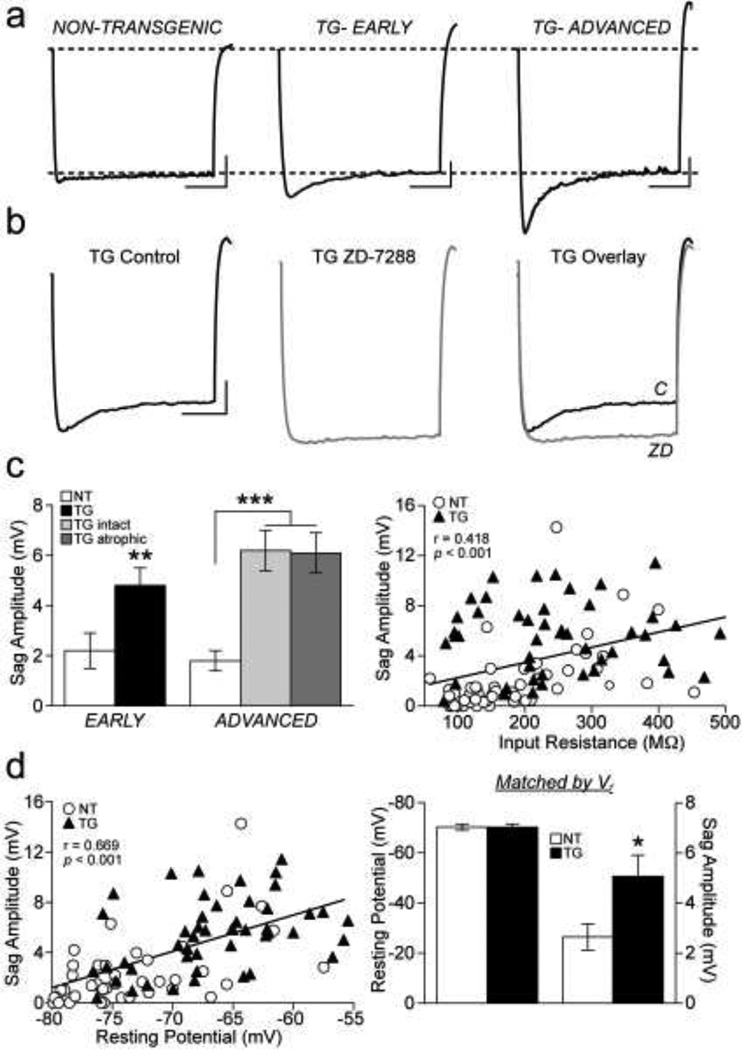
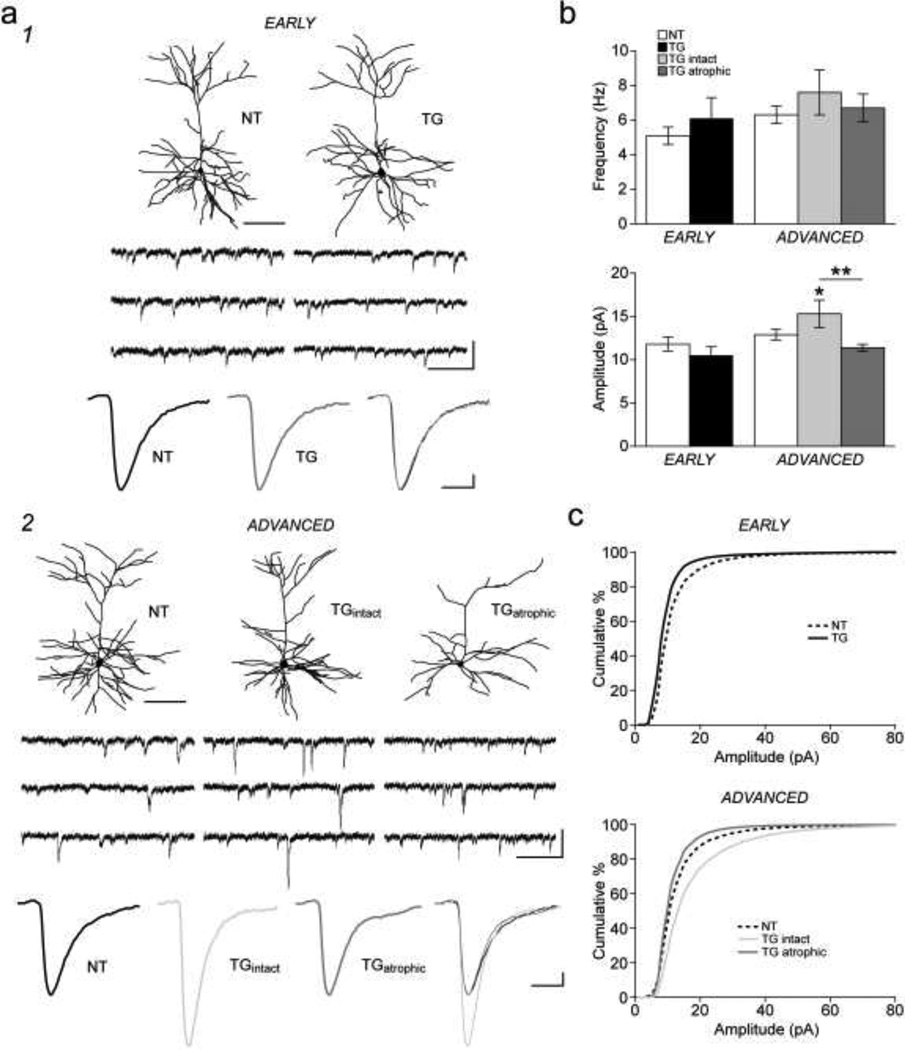
Whole-cell patch-clamp recordings and high-resolution morphometry were used to assess functional and structural properties of layer 3 pyramidal neurons in early (<4 months) and advanced (>8 months) stages of tauopathy in frontal cortical slices prepared from rTg4510 tau mutant (P301L) mice. In early tauopathy, dendritic architecture is preserved. In advanced tauopathy, neurons can be categorized as either "atrophic" (58 %)-exhibiting marked atrophy of the apical tuft, or "intact" (42 %)-with normal apical tufts and, in some instances, proliferative sprouting of oblique branches of the apical trunk. Approximately equal numbers of atrophic and intact neurons contain neurofibrillary tangles (NFTs) or are tangle-free, lending further support to the idea that NFTs per se are not toxic. Spine density is decreased due to a specific reduction in mushroom spines, but filopodia are increased in both atrophic and intact neurons. By contrast to these morphological changes, which are robust only in the advanced stage, significant electrophysiological changes are present in the early stage and persist in the advanced stage in both atrophic and intact neurons. The most marked of these changes are: a depolarized resting membrane potential, an increased depolarizing sag potential and increased action potential firing rates-all indicative of hyperexcitability. Spontaneous excitatory postsynaptic currents are not reduced in frequency or amplitude in either stage. The difference in the time course of functionally important electrophysiological changes versus regressive morphological changes implies differences in pathogenic mechanisms underlying functional and structural changes to neurons during progressive tauopathy.


Figures

Fig. 1
Fig. 1. Classification of neurons using 3D reconstructions and Thioflavin-S staining
a) Representative 3D reconstructions of layer 3 frontal cortical pyramidal neurons from NT (top row) and TG mice in early (middle row) and advanced (bottom row) stages of tauopathy. Arrowheads indicate atrophy of the apical tuft. Dashed boxes indicate regions from which confocal images in panel d were obtained. b) Left: scatter plot of the total lengths of the distal apical dendritic arbors of NT and TG neurons in early and advanced tauopathy. Arrowheads indicate distal apical values corresponding to neuron reconstructions shown on the right. Dashed line: 500 µm. Right: reconstructions of the NT and the TGatrophic neuron with distal apical values indicated by arrowheads in the scatter plot on the left. Dendrites highlighted in red indicate a small number of branches that extend several microns beyond the majority of branches in the distal apical tuft of the NT neuron, and an exuberant side branch of the apical dendritic trunk of the TGatrophic neuron; these branches contribute to the < 500 µm and the > 500 µm distal apical length values of these neurons respectively. Based on qualitative assessment of the apical tuft alone, the TGatrophic neuron was re-classified from the intact to the atrophic category. c) Pie chart showing relative proportions of TGintact and TGatrophic neurons that were either NFT+ or NFT−. d) Confocal images of the somata of TGintact and TGatrophic neurons indicated with dashed boxes in panel a. TG neurons either contained a Thioflavin-S positive NFT (d1,3) or were tangle-free (d2,4). Scale bars: a, 100 µm; d, 5 µm; n: early- 23 NT, 18 TG neurons; advanced- 34 NT, 15 TGintact, 21 TGatrophic neurons.
Fig. 2
Fig. 2. Lengths of apical and basal dendritic arbors
a) Top row: bar graphs of total dendritic length within proximal, middle and distal divisions of the apical arbors of NT and TG neurons in early (left) and advanced (right) tauopathy. Bottom row: reconstructions of entire dendritic arbors and dendrograms of apical dendritic arbors of a representative NT neuron and three TGintact neurons in advanced tauopathy. Basal dendritic arbors are indicated in grey, the apical trunks and oblique dendritic branches are indicated in red and apical dendritic tufts are indicated in black. b) Bar graphs of total dendritic length within proximal, middle and distal divisions of the basal dendritic arbors of TG and NT neurons in early (left) and advanced (right) tauopathy. *p < 0.05; ***p < 0.001; Fisher’s LSD test. n: early- 23 NT, 18 TG neurons; advanced- 34 NT, 15 TGintact, 21 TGatrophic neurons.
Fig. 3
Fig. 3. Dendritic spine density
a) 100× images of apical dendritic segments typical of those used for assessment of spines. b) Bar graph of mean spine density in NT and TG neurons in early and advanced tauopathy. c) Bar graphs of mean percent composition of spine subtypes in apical dendritic branches of NT and TG neurons in early and advanced tauopathy. *p < 0.05; **p < 0.01; ***p < 0.001; Fisher’s LSD test; scale bar: 3 µm; spine density, n: early- 12 NT, 16 TG branches; advanced- 18 NT, 18 TGintact, 18 TGatrophic branches; percent composition, n: early- 5 NT, 6 TG branches; advanced- 7 NT, 7 TGintact, 7 TGatrophic branches.
Fig. 4
Fig. 4. Action potential firing properties
a) Top row: reconstructions of neurons from which recordings shown in bottom rows were obtained. Middle row: membrane voltage responses evoked by a family of 2 s current pulses (−170, +30 and +130 pA) in a representative NT neuron and in TG neurons from early and advanced tauopathy. TG neurons in both stages of tauopathy have depolarized resting membrane potentials (Vr) and higher firing rates. Bottom row: Repetitive action potential firing elicited by a 10 s depolarizing current ramp from 0 to 200 pA. b) Relationship of firing rate (+130 pA current step) to resting membrane potential for all NT and TG neurons; linear regression (black line) demonstrates a significant positive correlation (left). Graph of mean firing rates in response to a +130 pA current step (middle) and in response to a series of depolarizing current steps (right). *p < 0.05; ***p < 0.001; Fisher’s LSD test; scale bars: a, top row- 100 µm; middle row- 20 mV/500 ms; bottom row- 20 mV/2 s; n: early- 22 NT, 18 TG neurons; advanced- 32 NT, 11 TGintact, 19 TGatrophic neurons.
Fig 5
Fig 5. Depolarizing sag potential properties
a) Depolarizing sag potentials evoked by a −170 pA current pulse expanded to demonstrate differences in amplitude in NT (left) versus TG neurons from early (middle) and advanced (right) tauopathy. Dashed lines: baseline membrane potential (top) and membrane steady state level (bottom). b) Depolarizing sag potential in a representative TG neuron under control conditions (left) and in the presence of HCN channel blocker ZD-7288 (middle). Superimposed traces of the sag potential under control conditions (C) and following ZD-7288 (ZD) block (right). c) Graph of mean sag potential amplitudes of NT and TG neurons in early and advanced tauopathy (left). Relationship of sag amplitude to input resistance for all NT and TG neurons; linear regression (black line) demonstrates a significant positive correlation (right). d) Relationship of sag amplitude to resting potential for all NT and TG neurons; linear regression (black line) demonstrates a significant positive correlation (left). Graph of mean membrane potential and sag potential amplitudes of NT and TG neurons with the same resting membrane potential (right). *p < 0.05; **p < 0.01; ***p < 0.001; Fisher’s LSD test (panel c, left) and Student’s t-test (panel d, right); scale bars: 5 mV/500 ms; n: early- 22 NT, 18 TG neurons; advanced- 32 NT, 11 TGintact, 19 TGatrophic neurons (panel c, left and right; panel d, left); n: NT- 21, TG- 20 neurons (panel d, right).
Fig. 6
Fig. 6. Spontaneous excitatory postsynaptic currents
a) (1) Top row: reconstructions of representative NT and TG neurons in early tauopathy from which sEPSC recordings (middle row) were obtained. Bottom row: averaged traces of sEPSCs typical of those used to assess current kinetics. Superimposed averaged traces (right) from the NT and TG neurons. (2) Top row: reconstructions of representative NT and TG neurons in advanced tauopathy from which sEPSC recordings (middle row) were obtained. Bottom row: averaged traces of sEPSCs typical of those used to assess current kinetics. Superimposed averaged traces (right) from the NT, TGintact and TGatrophic neurons. b) Bar graphs of mean frequency (top) and mean amplitude (bottom) of sEPSCs from NT and TG neurons in early and advanced tauopathy. c) Cumulative distribution histograms (1 pA bins) of sEPSC amplitudes from NT and TG neurons in early tauopathy (top) and advanced tauopathy (bottom). *p < 0.05; **p < 0.01; Fisher’s LSD test; scale bars: a1,2, top row- 100 µm; middle row- 20 pA/250 ms; bottom row- 1 pA/10 ms; n: early- 20 NT, 15 TG neurons; advanced- 31 NT, 13 TGintact, 19 TGatrophic neurons.

References

    1. Alonso AD, Grundke-Iqbal I, Barra HS, Iqbal K. Abnormal phosphorylation of tau and the mechanism of Alzheimer neurofibrillary degeneration: sequestration of microtubule-associated proteins 1 and 2 and the disassembly of microtubules by the abnormal tau. Proc Natl Acad Sci U S A. 1997;94(1):298–303. - PMC - PubMed
    1. Angelo K, Margrie TW. Population diversity and function of hyperpolarization-activated current in olfactory bulb mitral cells. Sci Rep. 2011;1:50. - PMC - PubMed
    1. Arendt T. Alzheimer's disease as a disorder of mechanisms underlying structural brain self-organization. Neuroscience. 2001;102(4):723–765. - PubMed
    1. Arriagada PV, Growdon JH, Hedley-Whyte ET, Hyman BT. Neurofibrillary tangles but not senile plaques parallel duration and severity of Alzheimer's disease. Neurology. 1992;42(3 Pt 1):631–639. - PubMed
    1. Berger Z, Roder H, Hanna A, Carlson A, Rangachari V, Yue M, Wszolek Z, Ashe K, Knight J, Dickson D, Andorfer C, Rosenberry TL, Lewis J, Hutton M, Janus C. Accumulation of pathological tau species and memory loss in a conditional model of tauopathy. J Neurosci. 2007;27(14):3650–3662. - PMC - PubMed

Publication types

LinkOut - more resources