. 2012 Dec 1;125(Pt 23):5677-89.
doi: 10.1242/jcs.107987. Epub 2012 Sep 12.

Intercellular adhesion molecule-1 is a regulator of blood-testis barrier function

Affiliations

Intercellular adhesion molecule-1 is a regulator of blood-testis barrier function

Xiang Xiao et al. J Cell Sci. .

Abstract

The mechanism underlying the movement of preleptotene/leptotene spermatocytes across the blood-testis barrier (BTB) during spermatogenesis is not well understood largely owing to the fact that the BTB, unlike most other blood-tissue barriers, is composed of several co-existing and co-functioning junction types. In the present study, we show that intercellular adhesion molecule-1 [ICAM-1, a Sertoli and germ cell adhesion protein having five immunoglobulin (Ig)-like domains, in addition to transmembrane and cytoplasmic domains] is a regulator of BTB integrity. Initial experiments showed ICAM-1 to co-immunoprecipitate and co-localize with tight junction and basal ectoplasmic specialization proteins such as occludin and N-cadherin, which contribute to BTB function. More importantly, overexpression of ICAM-1 in Sertoli cells in vitro enhanced barrier function when monitored by transepithelial electrical resistance measurements, illustrating that ICAM-1-mediated adhesion can promote BTB integrity. On the other hand, overexpression of a truncated form of ICAM-1 that consisted only of the five Ig-like domains (sICAM-1; this form of ICAM-1 is known to be secreted) elicited an opposite effect when Sertoli cell barrier function was found to be perturbed in vitro; in this case, sICAM-1 overexpression resulted in the downregulation of several BTB constituent proteins, which was probably mediated by Pyk2/p-Pyk2-Y402 and c-Src/p-Src-Y530. These findings were expanded to the in vivo level when BTB function was found to be disrupted following sICAM-1 overexpression. These data illustrate the existence of a unique mechanism in the mammalian testis where ICAM-1 can either positively or negatively regulate BTB function.


Figures

Fig. 1.
Fig. 1.
Presence of ICAM-1 in Sertoli cells, germ cells and adult rat testes shown by immunohistochemistry, immunoblotting and RT-PCR. (A) Frozen testes from control rats were cut at 7 µm, and immunohistochemistry was performed using a rabbit polyclonal antibody targeting the cytoplasmic domain of rat ICAM-1 (supplementary material Table S2). ICAM-1 immunoreactivity, which appeared as reddish-brown precipitates [3-amino-9-ethylcarbazole (AEC), b–h], was stage-specific. Stages of the seminiferous epithelial cycle are denoted as roman numerals (c,d,f–h). For the control (Ctrl), anti-ICAM-1 IgG was replaced with rabbit IgG, which was used at the same dilution (a). Asterisks (d) denote the luminal edge of a stage VIII tubule and show the presence of ICAM-1 before spermiation. Black arrowheads (e) point to the site of the BTB in a stage VIII tubule where ICAM-1 immunoreactivity was highest. Boxed areas (f–h) correspond to magnified images, which better depict ICAM-1 staining at the apical ES (white arrowheads). Scale bar in a (also applies to b) = 200 µm; scale bar in c (also applies to d,f–h) = 140 µm; scale bar in e = 70 µm; and scale bar in inset in f (also applies to insets in g,h) = 45 µm. (B) Sertoli cell (SC, cultured for 5 days in vitro), germ cell (GC, freshly isolated) and testis (T) lysates (∼50 µg protein/lane) were used for immunoblotting to demonstrate the monospecificity of the ICAM-1 antibody prior to its use for immunohistochemistry, as well as to show the presence of ICAM-1 in these cells and in this organ. The relative positions of protein bands corresponding to the MagicMark™ XP Western Protein Standard (Invitrogen) are noted to the left. Actin served as an internal control. Mr, molecular mass. (C) RT–PCR results for Icam1 using RNAs from Sertoli cells, germ cells and testis. S16 was used as an internal control. bp, base pairs; M, DNA molecular mass marker VI (Roche).
Fig. 2.
Fig. 2.
ICAM-1 is an integrated component of the BTB as demonstrated by co-IP experiments, confocal microscopy and dual-labelled immunofluorescent staining. (A) Co-IP experiments to determine the structural interactions between ICAM-1 and selected BTB constituent proteins when testis (T) or seminiferous tubule (ST) lysates (∼600–800 µg protein/sample) were used. For the positive control (+ve Ctrl), T or ST lysates (∼20–50 µg protein/lane) were used without co-IP. For the negative control (-ve Ctrl), anti-ICAM-1 IgG was replaced with rabbit (Rbt) IgG (supplementary material Table S2). IgGH and IgGL represent IgG heavy and light chains, respectively. This representative immunoblot also shows the uniform processing of samples. +, positive co-IP result; -, negative co-IP result. Proteins are categorized as TJ or basal ES proteins to the left of immunoblots. (B) To examine the co-localization of ICAM-1 with TJ and basal ES proteins in Sertoli cells, confocal microscopy was performed by using anti-ICAM-1 IgG (red, b,f) in conjunction with anti-occludin (green, a) or anti-N-cadherin IgG (green, e) (supplementary material Table S2). Cell nuclei were stained with DAPI (blue, c,g). Corresponding images were merged (c,d,g,h). As shown in the illustration to the left, images are presented as x-y and x-z planes, and the z-plane (yellow highlight) represents the plane at which partial co-localization of proteins at the Sertoli cell barrier is noted. Dashed straight lines (a,b,d–f,h) mark the sites at which x-z images were obtained, and these are shown immediately below x-y images. Scale bar in a (also applies to b–h) = 15 µm. (C) To examine the co-localization of ICAM-1 with TJ and basal ES proteins in the testis, dual-labeled immunofluorescent staining was performed by using anti-ICAM-1 IgG (red, b,f,j,n) in conjunction with anti-occludin (a), anti-ZO-1 (e), anti-N-cadherin (i) or anti-β-catenin (m) IgG (green) (supplementary material Table S2). Cell nuclei were stained with DAPI (d,h,l,p). Corresponding images were merged (c,d,g,h,k,l,o,p). Yellow arrowheads (d,h,l,p) point to the partial co-localization of ICAM-1 with BTB constituent proteins. Stages of the seminiferous epithelial cycle are denoted as roman numerals (d,h,l,p). The boxed area in (k) corresponds to the magnified image (inset), which better depicts the partial co-localization of ICAM-1 with N-cadherin. Dashed curved lines (b,f,j,n) mark the periphery of seminiferous tubules. Scale bar in a (also applies to b–p) = 100 µm; scale bar in inset in k = 40 µm.
Fig. 3.
Fig. 3.
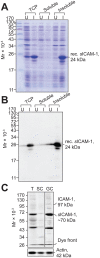
Production of a polyclonal sICAM-1 antibody and the presence of sICAM-1 in the testis. (A) Recombinant sICAM-1 (rec. sICAM-1) was expressed in E. coli, protein lysates obtained from soluble and insoluble fractions from both uninduced (U) and induced (I) bacterial cell cultures (∼100 µg protein/lane) were resolved by SDS-PAGE, and the gel was stained with Coomassie Blue. TCP, total cell protein. (B) Protein lysates (∼50 µg protein/lane) obtained from the above experimental step and identical to those shown in A were used for immunoblotting. Production of His6-tagged rec. sICAM-1 was verified first by a His6 antibody (B) and secondly by an ICAM-1 antibody (data not shown; it should be noted that this commercially available ICAM-1 antibody was raised against the extracellular domain of rat ICAM-1) (supplementary material Table S2). (C) Testis, Sertoli cell (SC, cultured for 5 days in vitro) and germ cell (GC, freshly isolated) lysates (∼30 µg protein/lane) were used for immunoblotting to demonstrate the monospecificity of the sICAM-1 antibody, as well as to show the presence of sICAM-1 in this organ and in these cells. Actin served as an internal control. The relative positions of protein bands corresponding to the MagicMark™ XP Western Protein Standard (Invitrogen) are noted to the left (A–C). Mr, molecular mass.
Fig. 4.
Fig. 4.
Preparation of ICAM-1 and sICAM-1 constructs based on the primary amino acid sequence of rat ICAM-1 and their effects on Sertoli cell barrier function after transient overexpression in vitro. (A) Schematic drawing of ICAM-1 (left) and sICAM-1 (right). ICAM-1 contains five Ig-like domains (D1–D5), a transmembrane domain and a cytoplasmic domain. Primary amino acid sequence corresponding to rat ICAM-1 (far right). The five Ig-like domains are denoted in bold, boxed and numbered. The putative signal peptide is double-underlined. The transmembrane domain is underlined, and the cytoplasmic domain is in italics. (B,C) Sertoli cells were cultured for 2 days to establish a functional barrier. They were then transfected with pCI-neo/MOCK, ICAM-1 or sICAM-1 containing plasmids (this time point was designated as time 0). Sertoli cells were terminated 2 days after transfection for lysate preparation, and co-IP experiments were performed (Ba,Ca). For the positive controls, Sertoli cell (SC, ∼60 µg protein/sample) and testis (T, ∼100 µg protein/sample) lysates were used without co-IP (Ba,Ca). For the negative control, anti-sICAM-1 (Ba,Ca) IgG was replaced with rabbit (Rbt) IgG (supplementary material Table S2). IgGH and IgGL represent IgG heavy and light chains, respectively. These representative immunoblots also show the uniform processing of samples. IP, immunoprecipitation; IB, immunoblotting. (Bb,Cb) Histograms summarizing co-IP/immunoblotting results. ICAM-1 and sICAM-1 overexpression data points were normalized against their corresponding pCI-neo/MOCK overexpression data points, which were arbitrarily set at 1. Each data point is a mean±s.d. of at least three independent co-IP experiments (**P<0.01). TER was monitored daily in functional experiments (Bc,Cc). ICAM-1 overexpression increased TER and promoted Sertoli cell barrier integrity (Bc), whereas sICAM-1 overexpression disrupted Sertoli cell barrier function (Cc). Each data point is a mean±S.D. of quintuplicate Millicell inserts within a representative experiment, and this experiment was repeated three times using different batches of Sertoli cells (**P<0.01). O-E, overexpression.
Fig. 5.
Fig. 5.
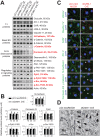
Down-regulation of basal ES and GJ proteins at the Sertoli cell barrier by sICAM-1 overexpression is mediated by Pyk2 and c-Src tyrosine kinases in vitro. (A) Sertoli cells were cultured for 2 days to establish a functional barrier. They were then transfected with pCI-neo/MOCK- or sICAM-1-containing plasmids (see legend to Fig. 4 for additional details). Sertoli cells were terminated 1, 2 and 3 days (d) after transfection, and lysates were obtained for immunoblotting (supplementary material Table S2). Actin served as an internal control. Proteins whose steady-state levels changed following sICAM-1 overexpression (O-E) versus pCI-neo/MOCK overexpression are labeled in red to the right of each immunoblot. Proteins are categorized as TJ, basal ES, GJ/desmosome and regulatory/signaling proteins to the left of the immunoblots. (B) Histograms summarizing immunoblotting results. Histograms are not shown for proteins whose steady-state levels did not change. Each data point was normalized against its corresponding actin data point, and then each sICAM-1 overexpression data point was normalized against its corresponding pCI-neo/MOCK overexpression data point. pCI-neo/MOCK data points were arbitrarily set at 1. Each data point is a mean±s.d. of at least three independent experiments. Within a single experiment, each data point consisted of triplicate wells. (*P<0.05; **P<0.01). (C) Immunofluorescent staining of Sertoli cells 2 days after DNA transfection. Transfection efficiency was monitored by using Cy3™-labelled plasmid DNA (red). Sertoli cells were fixed with methanol and immunostained with antibodies against BTB constituent proteins (supplementary material Table S2). No changes were observed in JAM-A, claudin-11, CAR and ZO-1 (green) localization following sICAM-1 overexpression. Asterisks denote changes in N-cadherin, γ-catenin and connexin 43 (green) localization following sICAM-1 overexpression when compared with the corresponding controls. Cell nuclei were stained with DAPI (blue). Corresponding images were merged. Scale bar (applies to all panels) = 50 µm. (D) Ultrastructural analysis by electron microscopy was performed on Sertoli cells 2 days after transfection with pCI-neo/MOCK- (left) or sICAM-1- (right) containing plasmids. White arrowheads (left) point to an intact Sertoli cell barrier following pCI-neo/MOCK overexpression. Black arrows (right) point to a disrupted Sertoli cell barrier following sICAM-1 overexpression. Scale bar (applies to both panels) = 825 nm. Nu, nucleus; SC, Sertoli cell.
Fig. 6.
Fig. 6.
Analysis of spermatogenesis, germ cell adhesion and BTB integrity following sICAM-1 overexpression. Semi-quantitative (A) and real-time (B) PCR results for sIcam-1 using RNAs from testes 2 days after the last administration of pCI-neo/MOCK- or sICAM-1-containing plasmids. For semi-quantitative PCR, a primer pair targeting an extracellular sequence of Icam-1 was used to assess the efficiency of sICAM-1 overexpression (O-E) (A) (supplementary material Table S1). S16 (A) and Gapdh (B) were used as internal controls. bp, base pairs; M, DNA Molecular Weight Marker VI (Roche). The sIcam-1 overexpression data was normalized against Gapdh, and then this value was normalized against its corresponding pCI-neo/MOCK overexpression data point (B). The pCI-neo/MOCK data point was arbitrarily set at 1. Each data point is a mean±s.d. of triplicate samples within a representative PCR experiment, and this experiment was repeated three times using cDNAs from different testes transfected with pCI-neo/MOCK- or sICAM-1-containing plasmids (*P<0.05). It is worth noting that semi-quantitative and quantitative PCR experiments cannot reliably discriminate between Icam-1 and sIcam-1 expression, even if a primer pair targeting an extracellular sequence of ICAM-1 is used to amplify sICAM-1. Although we have labeled PCR experiments as such for the sake of clarity, the inclusion of these data is only meant to support the results shown in (C and D). (C) Co-IP experiments were performed by using lysates from testes 2 days after the last administration of pCI-neo/MOCK- or sICAM-1-containing plasmids. For the positive controls, testis (T, ∼100 µg protein) and Sertoli cell (SC, ∼60 µg protein) lysates were used without co-IP. For the negative control, anti-sICAM-1 IgG was replaced with rabbit (Rbt) IgG (supplementary material Table S2). IgGH and IgGL represent IgG heavy and light chains, respectively. These representative immunoblots also show the uniform processing of samples. IB, immunoblotting; IP, immunoprecipitation. (D) Histogram summarizing co-IP/immunoblotting results. The sICAM-1 overexpression data point was normalized against its corresponding pCI-neo/MOCK overexpression data point, which was arbitrarily set at 1. Each data point is a mean±s.d. of at least three independent co-IP experiments (*P<0.05). (E) Paraffin-embedded testes from rats 2 days after the last administration of pCI-neo/MOCK- or sICAM-1-containing plasmids were cut at 5 µm, and sections were stained with hematoxylin and eosin. Scale bar (applies to both panels) = 280 µm. (F) Frozen testes from rats 2 days after the last administration of pCI-neo/MOCK- or sICAM-1-containing plasmids were cut at 7 µm, and sections were stained with DAPI (blue). Middle panels are magnified images of boxed areas in left panels, and right panels are magnified images of boxed areas in middle panels. Stages of the seminiferous epithelial cycle are denoted as roman numerals (top- and bottom-middle panels). White arrowheads (bottom-right panel) point to mis-oriented spermatids; scale bar, top left panel (also applies to bottom left panel) = 200 µm; scale bar, top middle panel (also applies to bottom middle panel) = 80 µm; scale bar, right panel (also applies to bottom right panel) = 20 µm. De, seminiferous epithelium width. (G) Histogram summarizing morphometric analysis from overexpression experiments. Results are expressed as a ratio of the width of the seminiferous epithelium (De) to the radius of the seminiferous tubule (Dr). Each data point is a mean±s.d. of ∼100 seminiferous tubules from each of 3–5 different rats, and at least ∼300 tubules per treatment group were used in this analysis (**P<0.01). (H) To assess BTB function following sICAM-1 overexpression, the diffusion of inulin-FITC (green) into the seminiferous epithelium from the systemic circulation was monitored by an integrity assay and fluorescence microscopy. For the positive control, rats received CdCl2 (3 mg/kg b.w., i.p.), and they were used for BTB integrity assays 3 days after the administration of CdCl2 (a,b). Testes from rats 2 days after the last administration of pCI-neo/MOCK- or sICAM-1-containing plasmids (c–f). Dashed curved lines (a,c,e) mark the periphery of seminiferous tubules. Arrows note the entry of (or lack thereof in the case of pCI-neo/MOCK) inulin-FITC into the adluminal compartment of the seminiferous epithelium. Cell nuclei were stained with DAPI. Scale bar in a (also applies to b–f) = 130 µm. (I) Histogram summarizing morphometric analysis from BTB integrity experiments. Results are expressed as a ratio of the diffusion of inulin-FITC (DFITC) to Dr. Each data point is a mean±s.d. of ∼100 seminiferous tubules from each of 3–5 different rats, and at least ∼300 tubules per treatment group were used in this analysis (**P<0.01). (J) Ultrastructural analysis by electron microscopy was performed on testes 2 days after the last administration of pCI-neo/MOCK- or sICAM-1-containing plasmids. White arrowheads (left) point to an intact BTB following pCI-neo/MOCK overexpression. Large black arrows (right) point to a disrupted BTB following sICAM-1 overexpression. Scale bar in left panel (also applies to right panel) = 880 nm. BM, basement membrane; Nu, nucleus; SC, Sertoli cell.
Fig. 7.
Fig. 7.
Changes in the localization and steady-state levels of BTB constituent proteins following sICAM-1 overexpression. (A) sICAM-1 overexpression (O-E) decreases the steady-state levels of basal ES and GJ (but not TJ or desmosome) proteins in the testis. Proteins whose steady-state levels changed following sICAM-1 overexpression versus pCI-neo/MOCK overexpression are labeled in red to the right of each immunoblot. Actin served as an internal control. (B) Histogram summarizing immunoblotting results. Histograms are not shown for proteins whose steady-state levels did not change. Each data point was normalized against its corresponding actin data point, and then each sICAM-1 overexpression data point was normalized against its corresponding pCI-neo/MOCK overexpression data point. pCI-neo/MOCK data points were arbitrarily set at 1. Each data point is a mean±s.d. of triplicate samples within a representative experiment, and this experiment was repeated at least three times using different testes transfected with pCI-neo/MOCK- or sICAM-1-containing plasmids. (**P<0.01). (C) Testes from rats 2–3 days after the last administration of pCI-neo/MOCK- or sICAM-1-containing plasmids were used for immunofluorescent staining (supplementary material Table S2). Boxed areas (a,c,e,g,i,k,m,o) correspond to magnified images (b,d,f,h,j,l,n,p), which better depict changes in protein localization. No changes were observed in occludin (red) localization following sICAM-1 overexpression when compared with the pCI-neo/MOCK control (e–h versus a–d). However, a decrease in N-cadherin (red) localization was observed when compared with the corresponding control (m–p versus i–l). Cell nuclei were stained with DAPI (blue). Scale bar in a (also applies to c,e,g,i,k,m,o) = 260 µm; scale bar in (b) (also applies to d,f,h,j,l,n,p) = 130 µm. (D) Changes in F-actin (green) localization at the BTB after sICAM-1 overexpression (d–f) versus pCI-neo/MOCK overexpression (a–c). Solid white line- and dashed yellow line-boxed areas (b,e) correspond to magnified images, which better depict changes in protein localization and changes in the relative orientation of spermatids. White arrowheads (f versus c) point to the loss of F-actin at the BTB. Yellow arrows point to the mis-orientation of spermatids. Scale bar in a (also applies to b,d,e) = 90 µm; scale bar in c (also applies to f) = 30 µm. (E) Paraffin-embedded testes from rats 2 days after the last administration of pCI-neo/MOCK- or sICAM-1-containing plasmids were cut at 5 µm, and immunohistochemistry was performed using a desmoglein-2 antibody (supplementary material Table S2). For the control (Ctrl), anti-desmoglein-2 IgG was replaced with rabbit IgG, which was used at the same dilution (b). Boxed areas (a,a1,c,c1,c2) correspond to magnified images, which better depict desmoglein-2 staining. Cell nuclei were stained with hematoxylin. Scale bar in a (also applies to b,c) = 120 µm; scale bar in a1 (also applies to c1,c2) = 80 µm; scale bar in inset in a1 (also applies to insets in c1,c2) = 40 µm. (F) Schematic illustration summarizing our working hypothesis (see Discussion for additional details).

Similar articles

Cited by

References

    1. Aravindan G. R., Pineau C. P., Bardin C. W., Cheng C. Y. (1996). Ability of trypsin in mimicking germ cell factors that affect Sertoli cell secretory function. J. Cell. Physiol. 168, 123–133 10.1002/(SICI)1097-4652(199607)168:1<123::AID-JCP15>3.0.CO;2-8 - DOI - PubMed
    1. Beck–Schimmer B., Schimmer R. C., Schmal H., Flory C. M., Friedl H. P., Pasch T., Ward P. A. (1998). Characterization of rat lung ICAM-1. Inflamm. Res. 47, 308–315 10.1007/s000110050334 - DOI - PubMed
    1. Byers S. W., Hadley M. A., Djakiew D., Dym M. (1986). Growth and characterization of polarized monolayers of epididymal epithelial cells and Sertoli cells in dual environment culture chambers. J. Androl. 7, 59–68 - PubMed
    1. Cheng C. Y., Bardin C. W. (1987). Identification of two testosterone-responsive testicular proteins in Sertoli cell-enriched culture medium whose secretion is suppressed by cells of the intact seminiferous tubule. J. Biol. Chem. 262, 12768–12779 - PubMed
    1. Cheng C. Y., Mruk D. D. (2002). Cell junction dynamics in the testis: Sertoli-germ cell interactions and male contraceptive development. Physiol. Rev. 82, 825–874 - PubMed

Publication types

Substances