. 2012 Oct;9(5):056012.
doi: 10.1088/1741-2560/9/5/056012. Epub 2012 Sep 13.

Facilitation and restoration of cognitive function in primate prefrontal cortex by a neuroprosthesis that utilizes minicolumn-specific neural firing

Affiliations

Facilitation and restoration of cognitive function in primate prefrontal cortex by a neuroprosthesis that utilizes minicolumn-specific neural firing

Robert E Hampson et al. J Neural Eng. 2012 Oct.

Abstract

Objective: Maintenance of cognitive control is a major concern for many human disease conditions; therefore, a major goal of human neuroprosthetics is to facilitate and/or recover the cognitive function when such circumstances impair appropriate decision making.

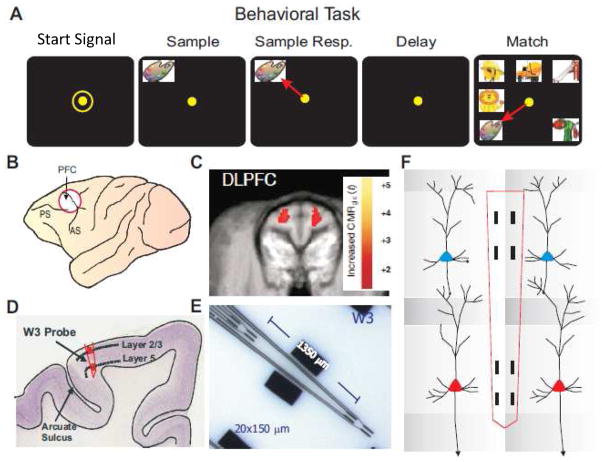
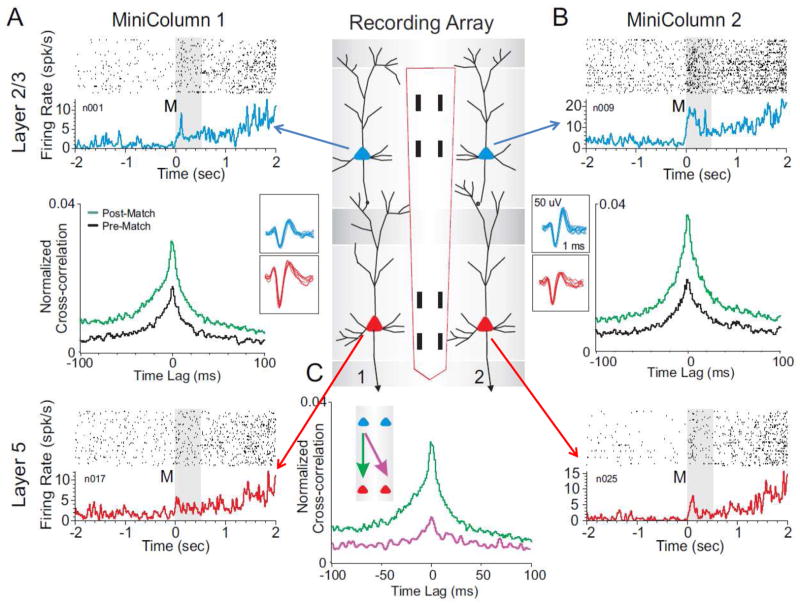
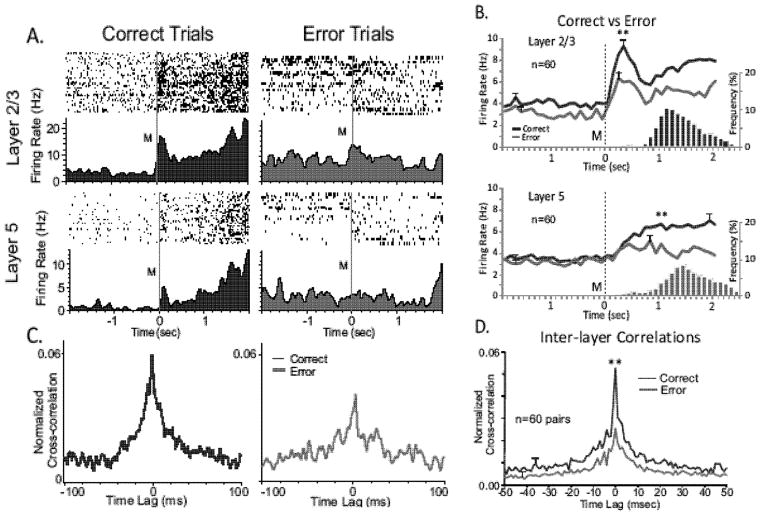
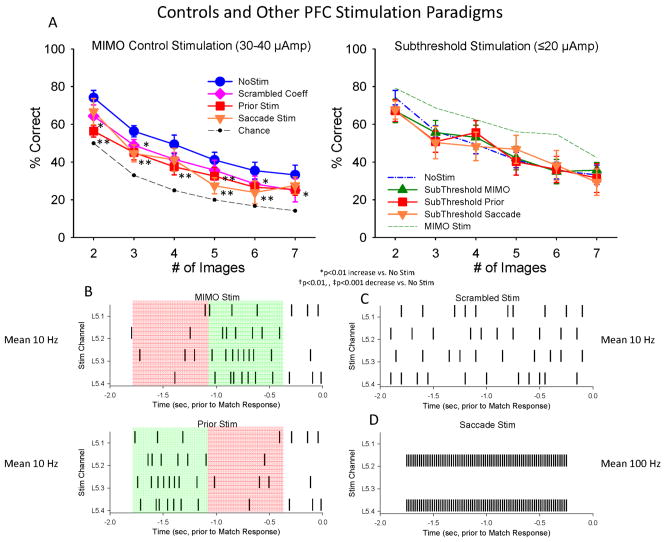
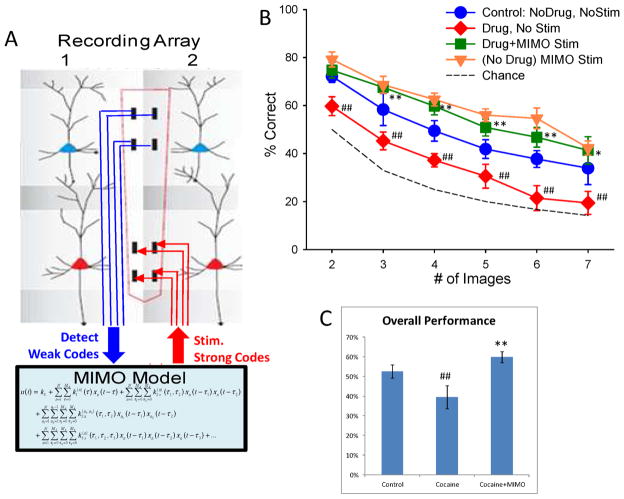
Approach: Minicolumnar activity from the prefrontal cortex (PFC) was recorded from nonhuman primates trained to perform a delayed match to sample (DMS), via custom-designed conformal multielectrode arrays that provided inter-laminar recordings from neurons in the PFC layer 2/3 and layer 5. Such recordings were analyzed via a previously demonstrated nonlinear multi-input-multi-output (MIMO) neuroprosthesis in rodents, which extracted and characterized multicolumnar firing patterns during DMS performance.

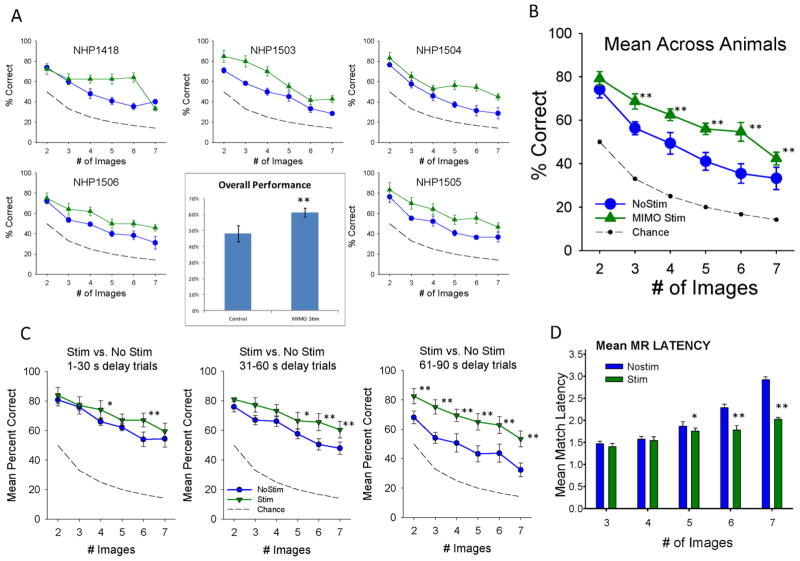
Main results: The MIMO model verified that the conformal recorded individual PFC minicolumns responded to entrained target selections in patterns critical for successful DMS performance. This allowed the substitution of task-related layer 5 neuron firing patterns with electrical stimulation in the same recording regions during columnar transmission from layer 2/3 at the time of target selection. Such stimulation improved normal task performance, but more importantly, recovered performance when applied as a neuroprosthesis following the pharmacological disruption of decision making in the same task.

Significance: These findings provide the first successful application of neuroprosthesis in the primate brain designed specifically to restore or repair the disrupted cognitive function.


Conflict of interest statement

The authors declare no competing financial interests.

Figures

Figure 1
Figure 1
Illustration of behavioral task and prefrontal cortical recording localization. A. Behavioral paradigm showing sequence of events in the DMS task: 1) ‘Focus Ring’ presentation and response to initiate the trial; commencing with 2) presentation of ‘Sample Target’ image; followed by 3) ‘Sample Response’ by cursor movement into the image; which initiates 4) variable ‘Delay’ period of 1–90 sec; prior to 5) presentation of the ‘Match’ Target (Sample image) accompanied by 1–6 Non-match (distracter) images on the same screen. Cursor movement into correct (Match target) image for 0.5s was rewarded by juice reward (0.5 ml) via a sipper tube next to the animal’s mouth. Placement of the cursor into a Non-match image for 0.5s caused the screen to blank without reward delivery. Intertrial interval (ITI): 10.0s. B. Diagram of NHP brain showing PFC recording locations (accessing cortical areas 46, 8, 6). C. Representative magnetic resonance image (MRI) of coronal section through dorsolateral prefrontal cortex (DLPFC) centered on the area in B. PET imaged localized cerebral metabolic rate (LCMRglu) activation (red blots) indicates metabolic activity of DLPFC during DMS task performance (Hampson et al., 2011; Porrino et al., 2007). D. Illustrated histologic section of DLPFC brain showing relative location of supra-granular layer 2/3 (L2/3) and infra-granular layer 5 (L5) with tract (in red) used for placement of conformal MEA recording (W3) probes shown in E. E. Ceramic conformal recording array custom designed (W3) for inter-laminar and inter-columnar cortical recording (diagram in F) consisting of dual sets of 4 recording pads vertically aligned and separated by 1350 μm the anatomic distance between L2/3 and L5 in primate brain. F. Dimensionally relevant illustration of the conformal MEA positioned for simultaneous recording from neurons in both layers in adjacent minicolumns (1&2), each minicolumn consisting of a “pair” of L2/3 and L5 PFC cells.
Figure 2
Figure 2
Coherence of inter-laminar activity within but not between adjacent prefrontal minicolumns during DMS task performance. The center panel shows the conformal multielectrode recording array (MEA) positioned for simultaneous inter-laminar columnar recording from adjacent minicolumns 1&2 (40 μm separation) with L2/3 and L5 cell pairs (Fig. 1f) shown as the corresponding (blue and red) cell waveforms. A&B show corresponding cell data as individual trial rasters and average perievent histograms (PEHs) obtained from two cell pairs recorded simultaneously from L2/3 (blue) and L5 (red) within the respective minicolumns. Rasters and PEHs depict ± 2.0s relative to Match phase (Fig. 1A) onset (0.0s) within a single DMS session. Cross-correlation histograms (CCHs) for the same cell pairs within each minicolumn are shown in the middle of the raster-PEH displays. The CCHs display increased inter-laminar synchronization during target selection (green) during the Match phase (0.0+2,0s, post) relative to similar correlations between the same cell pairs constructed 2.0s prior to onset (−2.0s to 0.0s in PEHs) of the Match phase (black, pre). C: Examples of post Match phase CCHs in which L2/3 and L5 cell pairs were localized to 1) the same (minicolumn #1, green arrow) or diagonally via 2) different minicolumns (i.e. L2/3 minicolumn #1, L5 minicolumn #2 purple arrow) which was not significant (F(1,401)<3.22, p>0.10) show the specificity of MEA columnar orientation. Post-Match CCHs for cell pairs from all types of diagonal comparisons on the same MEA across different minicolumns were previously reported (Opris et al 2011).
Figure 3
Figure 3
Differences in PFC columnar processing on correct vs. error trials. A. Match phase rasters and PEHs recorded from a L2/3 (upper) and L5 (lower) cell pair within a single minicolumn, segregated as to correct (blue) and error (red) trials during a single session (n= 120 trials). B. Line graphs represent mean Match phase PEHs averaged over all recorded inter-laminar PFC cell pairs (n= 60), L2/3 (upper) & L5 (lower), on correct (blue) vs. error trials (red) summed across animals and sessions. No more than 2 cell pairs were recorded in same behavioral session from the same MEA. Blue (correct) and Red (error) bar graphs show the associated mean frequency distributions of Match Response latencies for the same associated correct and error trials plotted on the same time-base as the PEHs relative to Match phase onset (0.0s). C. Coherent intralaminar activity of L2/3 and L5 neuron pair segregated by correct and error trials as in A. CCHs indicate respective correct and error trial paired neural firing during first 1.0 second after Match presentation (M, time=0.0s above). D. Normalized cross-correlograms of Match phase firing (Fig. 2) between the same pair of (L2/3 and L5) cells for correct (blue) vs. error (red) trials during same session shown in A. D. Tuning plots (as in Fig. 3b) constructed for same pair of cells shown in A on correct (blue) vs. error (red) trials. Tuning bias= 135° for both cells. E. Mean cross-correlation histograms CCHs for the same inter-laminar cell pairs (n=60) shown in B constructed from correct (blue) and error (red) trials. **F(1,401) = 14.18, p < 0.001.
Figure 4
Figure 4
Integration of MIMO model for calculating MR codes from L2/3 recordings and delivering output pulses to L5 recording pads to mimic strong codes during DMS task. Schematic shows prefrontal cortical (PFC L2/3) recording and NHP MIMO model with feedback stimulation applied to PFC L5. Neural recordings from Layer 2/3 are analyzed to predict Layer 5 neural activity, which is in turn used to generate stimulation patterns applied to Layer 5 recording sites. MIMO model coefficients applicable to PFC recordings distinguish different features of the DMS task. This has provided the means to test the specificity of the MIMO codes recorded in L2/3 that occur on different types of trials (with different cognitive load) when applied as stimulation patterns to L5.
Figure 5
Figure 5
Facilitation of DMS Performance by MIMO Stimulation A. MIMO stimulation applied to prefrontal cortex in five NHPs (indicated by number) performing the DMS task under normal conditions. MIMO model was adapted to utilize L2/3 input to predict L5 output patterns delivered as electrical stimulation (Fig. 4) during target image selection in the Match phase of the task (Fig. 1a). Each graph shows mean DMS performance (±S.E.M.) as a function of trial complexity indicated by number of images (2–7) over 3–5 sessions comprised of ≥120 trials per session. Performance is shown for normal trials in which stimulation was not delivered (No Stim) and trials in the same session in which MIMO model derived stimulation was delivered to the PFC L5 (MIMO Stim) recording sites on MEAs for 2.0 sec corresponding to limb movements associated with the Match Response. Dashed line indicates performance that could be achieved by random “chance” selection at each degree of Match difficulty related to the number of images to select from. Inset: Average overall performance summed across trials, animals and sessions for No Stim vs. Stim trials. **F(5,239) > 42.16, p<0.001 increase compared to No Stim. B. Mean DMS performance as a function of # Images across all animals shown in A for Stim vs. No Stim trials. **F(1,239)>18.34, p<0.001 increase compared to No Stim. C. Effect of MIMO Stimulation on DMS trials with differing delays as a function of number of images. Same results shown in B sorted by duration of trial delay prior to Match phase onset (Figure 1a) for No Stim vs. Stim trials. *F(1,239)>8.22, p<0.01; **F(1,239)>13.40, p<0.001 increase compared to No Stim. D. Effect of MIMO stimulation on mean Match Response (MR) latency to respond to the Match image on No Stim vs. Stim trials. Mean (±S.E.M.) latencies (in sec) across animals and sessions as a function of number of images presented in the Match phase. *F(1,239)=9.51, p<0.01; **F(1,239)>21.29, p<0.001 vs. No Stim.
Figure 6
Figure 6
Lack of DMS facilitation by Control stimulation paradigms which were not synchronized to MIMO-extracted PFC neuron firing. Mean (±S.E.M.) DMS performance summed across all animals (n=5) on trials with stimulation parameters and patterns (shown in B&C) that differed or were administered differently from those generated by the MIMO model (Figure 5). A. Left: Mean DMS performance on trials with three different types of non-MIMO Stim patterns (in B) delivered at the same intensity and pulse duration as MIMO Stim (30–40 μA, 1 ms pulses) was decreased compared to control (NoStim) performance. *F(1,239)>7.31, p<0.01; **F(1,239)>12.56, p<0.001 decrease vs. No Stim. Right: DMS performance across animals on trials receiving the same non-MIMO stimulation patterns shown at left with reduced current levels (≤ 20 μA). Dotted green curve shows performance on trials with MIMO Stim (Fig. 5b). B. PRIOR Stim pattern: The pattern consisted of the same stimulation channels and interstimulus intervals as the MIMO-derived Stim pattern (MIMO Stim, top), however the early and late epochs of stimulation were inverted temporally such that stimulation that normally occurred synchronous with the Match phase response was now delivered prior to the Match response (Prior Stim, bottom). The illustration shows stimulation on a single trial in the Match phase, contrasting MIMO Stim patterns at the top in green starting 1.0s after Match phase onset (−2.0s), with the control MIMO Stim pattern starting at 0.25s after Match phase onset (bottom, in green) and terminating 1.0 sec Prior to the Match Phase Response (0.0s). C. Scrambled Stim with randomized MIMO coefficients and the same overall frequency and number of stimulation pulses as MIMO Stim delivered in same Match phase time interval; D. Saccade Stim refers to stimulation associated with saccade generation with fixed frequency (100 Hz) delivered at the same intensity in the same Match phase interval as MIMO Stim (Fig. 5).
Figure 7
Figure 7
Pharmacological interruption of DMS-dependent inter-laminar processing. Effects of midsession cocaine administration (0.40 mg/kg IV) on L2/3-L5 cell pair firing during performance of DMS task. A: Rasters and PEHs show Match phase L2/3 and L5 inter-laminar activity as in Figures 2&3 during the initial control (saline, blue) portion of the session and after cocaine administration (cocaine, red) midway through the same session. **F(1,958) > 19.72, p<0.001 vs. Control (saline). B. Average PEHs for control (upper) vs. cocaine trials (lower) summed over all inter-laminar L2/3 (blue) & L5 (red) PFC cell pairs (n=30) recorded in the same sessions with cocaine administered at the midpoint (trial #62) of the session. Black (control) and green (cocaine) histograms show mean frequency distributions of latencies to make the MR relative to Match phase onset (M, 0.0s). *F(1,958) = 13.43, p < 0.001 vs. Control. C. Cross-correlograms (CCHs) of firing between the L2/3 and L5 cell pair shown in A constructed from control trials (n=62) in the first half of the session (blue-left), and after cocaine administration during the second half of the same session (red-right). **F(1,401) = 17.22, p<0.001 vs. Control. D. Mean cross-correlation histograms (CCHs) for the same inter-laminar cell pairs (n=30) shown in B constructed from trials in the control (blue) vs. cocaine (red) halves of the session. **F(1,401) = 11.22, p < 0.001, vs. Control. E. Scatter plot of normalized cross-correlation coefficients from cell pairs shown in D for control (horizontal axis) and cocaine (vertical axis) halves of the same DMS sessions. Distribution of coefficients along the diagonal line would represent no change in correlation coefficients between the two halves of the session, whereas the demonstrated lack of coefficients distributed in that manner reflects a significant change in inter-laminar correlated cell firing after cocaine administration. F. Reduction in DMS (% correct) performance for all animals on trials with varying number of images (Figures 5&6) for control vs. cocaine segments of the same sessions (n=19). **F(1,239)>16.01, p<0.001 Cocaine vs. Control.
Figure 8
Figure 8
MIMO-based Neural Prosthetic Recovery of PFC Dependent DMS Performance. A. Application of MIMO model detects more “weak code” L2/3 firing associated with error trials in DMS performance following cocaine exposure (Fig. 7). Output of MIMO model is then utilized to stimulate L5 with a “strong code” L5 pattern associated with correct (Control) performance at the time of target selection in the Match phase. B. DMS performance resulting from MIMO stimulation applied to prefrontal cortex in five nonhuman primates receiving split sessions in which each animal received saline injection prior to start of the behavioral sessions, and the received cocaine (0.4 mg/kg IV) at the midpoint of the behavioral session. DMS mean (±S.E.M.) performance during 1) control (no drug, no stim) half of the session, compared to 2) nonstimulated trials (Drug, No Stim) in the cocaine half of the session and 3) MIMO stimulated (Drug+MIMO Stim) trials in the cocaine half of the same session. Performance on MIMO Stim trials in the absence of drug (Fig. 5) is also shown for comparison (No drug MIMO Stim). ##F(1,239)>16.82, p<0.001 decrease vs. Control. *F(1,239)=7.22, p<0.01; **F(1,239)>10.63, p<0.001 increase vs. Control. C. Overall performance (mean ± S.E.M.) shown for all animals on trials in 1) non-drug half of session (Control), 2) Cocaine half of session on trials with no stimulation (Cocaine) and 3) Cocaine half of session on trials with MIMO stimulation (Cocaine+MIMO). ##F(5,239)=42.53, p<0.001; performance decrease vs. Control; **F(5,239)>15.05, p<0.001 performance increase vs. Control.

Similar articles

Cited by

References

    1. Arnsten AF. Stress impairs prefrontal cortical function in rats and monkeys: role of dopamine D1 and norepinephrine alpha-1 receptor mechanisms. Prog Brain Res. 2000;126:183–92. - PubMed
    1. Baddeley A. Fractionating the central executive. In: Stuss DT, Knight RT, editors. Principles of Frontal Lobe Function. New York: Oxford University Press; 2002. pp. 246–260.
    1. Berger TW, Ahuja A, Courellis SH, Deadwyler SA, Erinjippurath G, Gerhardt GA, Gholmieh G, Granacki JJ, Hampson R, Hsaio MC, LaCoss J, Marmarelis VZ, Nasiatka P, Srinivasan V, Song D, Tanguay AR, Wills J. Restoring lost cognitive function. IEEE Eng Med Biol Mag. 2005;24:30–44. - PubMed
    1. Berger TW, Hampson RE, Song D, Goonawardena A, Marmarelis VZ, Deadwyler SA. A cortical neural prosthesis for restoring and enhancing memory. Journal of Neural Engineering. 2011;8:046017. - PMC - PubMed
    1. Berger TW, Song D, Chan RHM, Marmarelis VZ, LaCoss J, Wills J, Hampson RE, Deadwyler SA, Granacki JJ. A hippocampal cognitive prosthesis: Multi-input, multi-output nonllinear modeling and VLSI instrumentation. IEEE Transactions on Neural Systems and Rehabilitation Engineering. 2012;20:198–211. - PMC - PubMed

Publication types