. 2013 Feb;30(2):315-31.
doi: 10.1093/molbev/mss221. Epub 2012 Sep 13.

Evolution of conjugation and type IV secretion systems

Affiliations

Evolution of conjugation and type IV secretion systems

Julien Guglielmini et al. Mol Biol Evol. 2013 Feb.

Abstract

Genetic exchange by conjugation is responsible for the spread of resistance, virulence, and social traits among prokaryotes. Recent works unraveled the functioning of the underlying type IV secretion systems (T4SS) and its distribution and recruitment for other biological processes (exaptation), notably pathogenesis. We analyzed the phylogeny of key conjugation proteins to infer the evolutionary history of conjugation and T4SS. We show that single-stranded DNA (ssDNA) and double-stranded DNA (dsDNA) conjugation, while both based on a key AAA(+) ATPase, diverged before the last common ancestor of bacteria. The two key ATPases of ssDNA conjugation are monophyletic, having diverged at an early stage from dsDNA translocases. Our data suggest that ssDNA conjugation arose first in diderm bacteria, possibly Proteobacteria, and then spread to other bacterial phyla, including bacterial monoderms and Archaea. Identifiable T4SS fall within the eight monophyletic groups, determined by both taxonomy and structure of the cell envelope. Transfer to monoderms might have occurred only once, but followed diverse adaptive paths. Remarkably, some Firmicutes developed a new conjugation system based on an atypical relaxase and an ATPase derived from a dsDNA translocase. The observed evolutionary rates and patterns of presence/absence of specific T4SS proteins show that conjugation systems are often and independently exapted for other functions. This work brings a natural basis for the classification of all kinds of conjugative systems, thus tackling a problem that is growing as fast as genomic databases. Our analysis provides the first global picture of the evolution of conjugation and shows how a self-transferrable complex multiprotein system has adapted to different taxa and often been recruited by the host. As conjugation systems became specific to certain clades and cell envelopes, they may have biased the rate and direction of gene transfer by conjugation within prokaryotes.


Figures
F<sc>ig</sc>. 1.
Fig. 1.
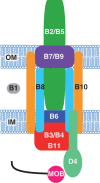
Scheme of the most-studied T4SS, the vir system of A. tumefaciens Ti plasmid. The VirBX proteins are depicted as BX (e.g., B5 refers to the VirB5 protein). The coupling protein VirD4 (D4) and the mobilization complex, which includes the relaxase (MOB)-DNA complex are also represented. OM: outer membrane; IM: inner membrane.
F<sc>ig</sc>. 2.
Fig. 2.
Phylogenetic analysis of the AAA+ ATPases associated with conjugation. The position of the root was determined using the AAA+ ATPase VirB11 in a separate analysis. Names along the FtsK tips correspond to the taxonomic origins of each protein, reflecting the width of sampling. Bold vertical black lines represent nodes with a high support value (bootstrap >70% and aLRT >0.7). Bold gray lines represent nodes with high aLRT score (>0.7) but a weaker bootstrap (<70%). The homologs of TcpA are found only in Firmicutes. The homologs of TraB are found only in Actinobacteria. Numbers in circles refer to the analysis of robustness in table 1 (identified in the third column of table 1); black background stands for a high support (≥70% bootstrap in the best-scoring alignment) and gray background for a moderate support (≥50% bootstrap in the best-scoring alignment).
F<sc>ig</sc>. 3.
Fig. 3.
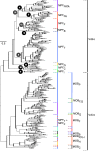
Joint phylogenetic reconstruction of the VirD4 and VirB4/TraU families of proteins from conjugative systems. Bold vertical black lines represent nodes with a high support value (aLRT ≥ 0.9), and black vertical gray lines represent nodes with a support value between 0.7 and 0.9. Black square brackets indicate the VirB4 and VirD4 clades; colored square brackets on the left delimit the different MPF clades (purple: MPFFATA, orange: MPFFA, red: MPFF, black: MPFB, blue: MPFT, yellow: MPFG, cyan: MPFC, green: MPFI); colored square brackets on the right delimit the relaxase clades within the VirD4 part of the tree (blue: MOBP, green: MOBQ, red: MOBF, purple: MOBB, orange: MOBH, brown MOBC, red/green dashed brackets: clades with a mix of MOBF and MOBQ; black: mix of MOBP, MOBF and MOBH). Numbers in circles refer to the analysis of robustness in table 1 (identified in the third column of table 1); black background stands for a high support (≥70% bootstrap in the best-scoring alignment) and gray background for a moderate support (≥50% bootstrap in the best-scoring alignment).
F<sc>ig</sc>. 4.
Fig. 4.
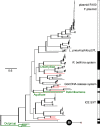
Phylogenetic analysis of MPFT VirB4 proteins. Bold vertical black lines represent nodes with a high support value (bootstrap > 90%), and bold vertical gray lines represent nodes with a support value between 70% and 90%. Green branches correspond to taxa that are not within Proteobacteria (or the outgroup). Red branches represent VirB4 not associated to a relaxase (MOBless T4SS). The leftmost vertical bar on the right stands for chromosomal (black) or plasmidic (white) proteins. The colored bar represents the different gene order patterns found; the patterns and their corresponding color are depicted at the bottom (the numbers represent the corresponding virB gene); a pattern is attributed to a system if, considering the possibly missing vir genes, the gene order is preserved. For example, a system composed of the genes virB1, virB4, virB6, virB5, virB8, virB9, and virB10 in this order will be assigned to the orange pattern. Unique or atypical patterns are depicted in black. Known representative systems are labeled. Numbers in circles refer to the analysis of robustness in table 1 (identified in the third column of table 1); black background stands for a high support (≥70% bootstrap in the best-scoring alignment) and gray background for a moderate support (≥50% bootstrap in the best-scoring alignment).
F<sc>ig</sc>. 5.
Fig. 5.
Phylogenetic analysis of MPFF VirB4 proteins. Bold vertical black lines represent nodes with a high support value (bootstrap >90%), and bold vertical gray lines represent nodes with a support value between 70% and 90%. Green branches correspond to taxa that are not from Proteobacteria (plus the outgroup). Red branches represent the VirB4 not associated to a relaxase (MOBless T4SS). Green and red dotted branches represent MOBless T4SS that are not from Proteobacteria. The bar on the right stands for the chromosomal (black) or plasmidic (white) proteins. Known representative systems are labeled. The GGI DNA release system corresponds to the N. gonorrhoeae gonococcal genetic island (Hamilton et al. 2005). Number in circles refers to the analysis of robustness in table 1 (identified in the third column of table 1); black background stands for a high support (≥70% bootstrap in the best-scoring alignment) and gray background for a moderate support (≥50% bootstrap in the best-scoring alignment).
F<sc>ig</sc>.
6.
Fig. 6.
Phylogenetic analysis of MPFFATA VirB4 proteins. Bold vertical black lines represent nodes with a high support value (bootstrap >90%), and bold vertical gray lines represent nodes with a support value between 70% and 90%. Squared brackets delimit the different taxonomic clades (plus the outgroup). Red branches represent the VirB4 not associated to a relaxase (MOBless T4SS). The bar on the right stands for the chromosomal (black) or plasmidic (white) proteins. Numbers in circles refer to the analysis of robustness in table 1 (identified in the third column of table 1); black background stands for a high support (≥70% bootstrap in the best-scoring alignment) and gray background for a moderate support (≥50% bootstrap in the best-scoring alignment).
F<sc>ig</sc>.
7.
Fig. 7.
Phylogenetic analysis of MPFFA VirB4 proteins. Bold vertical black lines represent nodes with a high support value (bootstrap >90%), and bold vertical gray lines represent nodes with a support value between 70% and 90%. Squared brackets delimit the different taxonomic clades (plus the outgroup). Red branches represent the VirB4 not associated to a relaxase (MOBless T4SS). The bar on the right stands for the chromosomal (black) or plasmidic (white) proteins. Numbers in circles refer to the analysis of robustness in table 1 (identified in the third column of table 1); black background stands for a high support (≥70% bootstrap in the best-scoring alignment) and gray background for a moderate support (≥50% bootstrap in the best-scoring alignment).
F<sc>ig</sc>. 8.
Fig. 8.
Model for the evolution of conjugation. First, DNA translocases diversify into a number of families that are involved in conjugation (ssDNA for VirB4, VirD4, and TcpA, and dsDNA for TraB). Second, ssDNA conjugation diversified in a series of clades that are the basis of MPF classes. Several of these show a preponderance of Proteobacteria. Transfer of a conjugative system to monoderms led to the diversification and further spread within Firmicutes, Actinobacteria, Archaea, and Tenericutes. Among MPFFA, some elements engaged in a dramatically different system, including TcpA and the relaxase MOBT. Finally, at much shorter evolutionary distances, we observe diversification of conjugative systems among integrative (ICEs) and extrachromosomal (plasmids) elements. Exaptation of the conjugative systems for protein delivery, DNA uptake and other, also arise relatively late in the evolutionary scale.

Similar articles

Cited by

References

    1. Allen HK, Donato J, Wang HH, Cloud-Hansen KA, Davies J, Handelsman J. Call of the wild: antibiotic resistance genes in natural environments. Nat Rev Microbiol. 2010;8:251–259. - PubMed
    1. Alvarez-Martinez CE, Christie PJ. Biological diversity of prokaryotic type IV secretion systems. Microbiol Mol Biol Rev. 2009;73:775–808. - PMC - PubMed
    1. Amabile-Cuevas CF, Chicurel ME. Bacterial plasmids and gene flux. Cell. 1992;70:189–199. - PubMed
    1. An D, Na C, Bielawski J, Hannun YA, Kasper DL. Membrane sphingolipids as essential molecular signals for Bacteroides survival in the intestine. Proc Natl Acad Sci U S A. 2011;108(Suppl 1):4666–4671. - PMC - PubMed
    1. Babic A, Berkmen MB, Lee CA, Grossman AD. Efficient gene transfer in bacterial cell chains. MBio. 2011;2:e00027–00011. - PMC - PubMed

Publication types

Substances