. 2013 Feb;30(2):332-46.
doi: 10.1093/molbev/mss218. Epub 2012 Sep 12.

Coevolution reveals a network of human proteins originating with multicellularity

Affiliations

Coevolution reveals a network of human proteins originating with multicellularity

Alexandr Bezginov et al. Mol Biol Evol. 2013 Feb.

Abstract

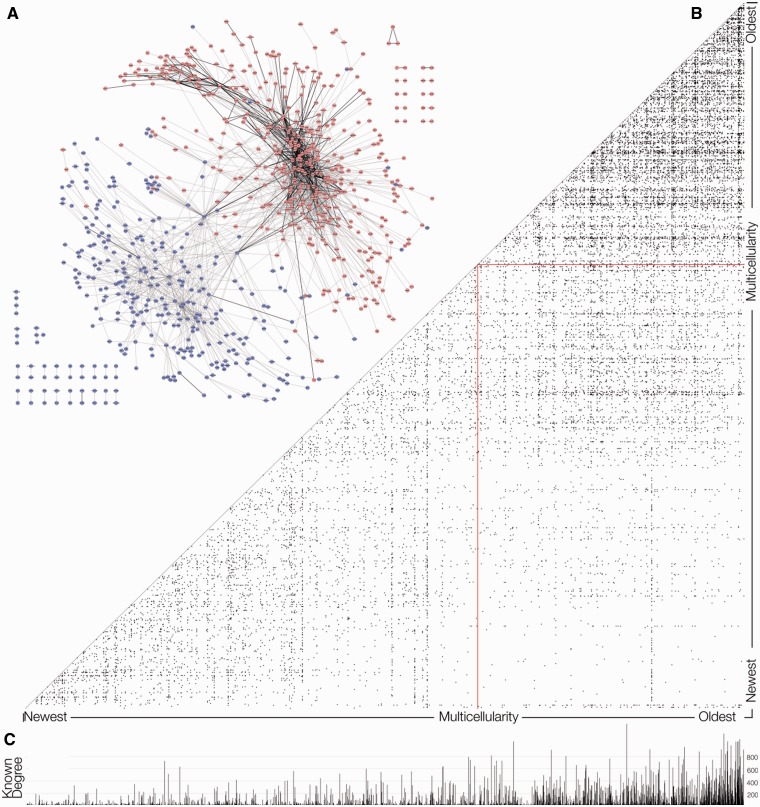
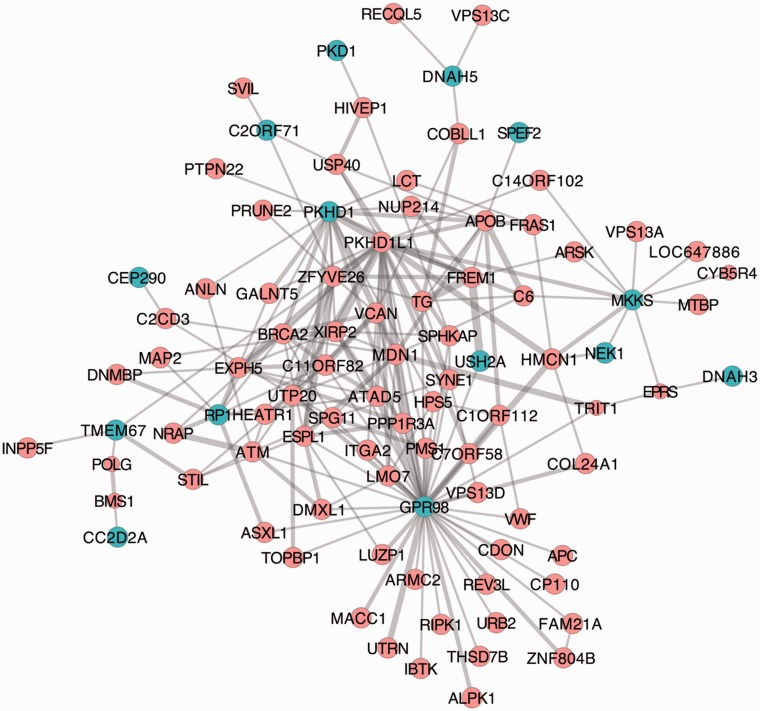
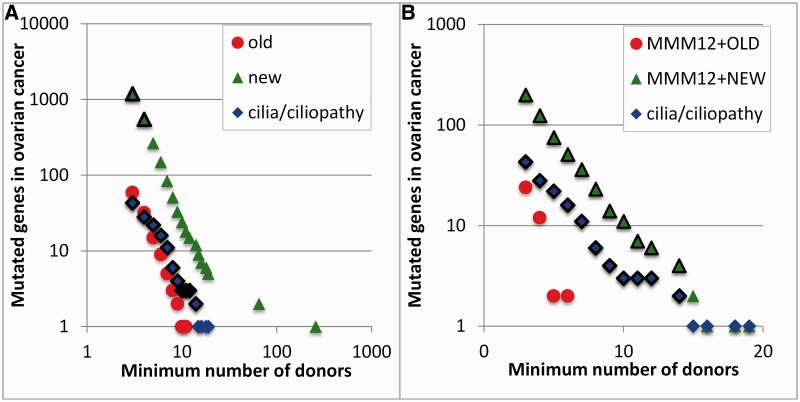
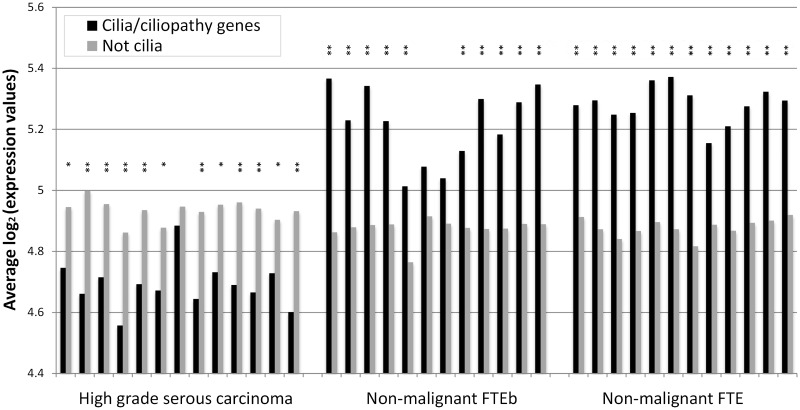
Protein interaction networks play central roles in biological systems, from simple metabolic pathways through complex programs permitting the development of organisms. Multicellularity could only have arisen from a careful orchestration of cellular and molecular roles and responsibilities, all properly controlled and regulated. Disease reflects a breakdown of this organismal homeostasis. To better understand the evolution of interactions whose dysfunction may be contributing factors to disease, we derived the human protein coevolution network using our MatrixMatchMaker algorithm and using the Orthologous MAtrix project (OMA) database as a source for protein orthologs from 103 eukaryotic genomes. We annotated the coevolution network using protein-protein interaction data, many functional data sources, and we explored the evolutionary rates and dates of emergence of the proteins in our data set. Strikingly, clustering based only on the topology of the coevolution network partitions it into two subnetworks, one generally representing ancient eukaryotic functions and the other functions more recently acquired during animal evolution. That latter subnetwork is enriched for proteins with roles in cell-cell communication, the control of cell division, and related multicellular functions. Further annotation using data from genetic disease databases and cancer genome sequences strongly implicates these proteins in both ciliopathies and cancer. The enrichment for such disease markers in the animal network suggests a functional link between these coevolving proteins. Genetic validation corroborates the recruitment of ancient cilia in the evolution of multicellularity.


Figures

F<sc>ig</sc>. 1.
Fig. 1.
The MMM13+ network. (A) This display of the MMM13+ network was produced using Cytoscape v.8.0’s spring-embedded layout (Shannon et al. 2003). Clustering of the network according to its network topology was separately done using the Map equation algorithm (see Materials and Methods). The pink nodes indicate that they are found in evolutionarily OLD clusters, that is, Map equation clusters of the MMM12+ network with an average distance dating to before the origin of animals. The blue nodes are in clusters that have an average age no older than the origin of animals, although some individual nodes within those clusters are older. (B) The MMM12+ network, represented as a heat map (Tarassov and Michnick 2005), also shows fewer old-to-new edges than new-to-new or old-to-old edges. (C) The degree for nodes in the known interaction network is higher for older nodes, indicating that more interactions are known among the older proteins.
F<sc>ig</sc>. 2.
Fig. 2.
Accuracy of MMM. (A) Precision of MMM predictions (the frequency of coevolving pairs that are known interactions from PPI databases) increases with higher MMM score thresholds (x axis). Considering HPRD only, it contains far fewer interactions, and none with very high MMM scores. (B) MMM scores correlate with the average interaction scores from Drosophila based on mass spectrometry analyses. (C), (D), and (E) show a high correlation of MMM scores with average scores from other PPI prediction methods (IntnetDB, STRING, and HumanNet, respectively, each with their own scoring scale); this is true for all MMM predictions and for the subset that are known interactions. The correlation coefficient is shown for the MMM predictions, and error bars indicate one standard deviation over all MMM pairs. (F) Node degree frequency for proteins in the known interaction network and in the MMM12+ network shows that they are both scale free.
F<sc>ig</sc>. 3.
Fig. 3.
New nodes and NEW network. (A) Frequency of NEW nodes decreases with increasing degree. (B) Frequency of node age for all proteins analyzed and for the known and MMM12+ networks. (C) The relative evolutionary rate (rates ratio to average matrix), as a function of the age of proteins is plotted for all proteins analyzed and for those in the MMM12+ network. The range was much reduced for proteins in the network, indicating that these neither evolve extremely quickly nor slowly. (D) The difference between the rates ratio of two proteins interacting (MMM12+ Known) or coevolving (MMM12+) decreases with MMM score, indicating that coevolving proteins also have similar rates of evolution.
F<sc>ig</sc>. 4.
Fig. 4.
MMM coevolution and coexpression. (A) The average Pearson correlation (R2) measuring the coexpression of gene pairs in the MMM12+ and its subset of known interactions (MMM12+ Known) increases with MMM score. (B) Frequency distribution of the Pearson correlation (R) of coexpression over the E-MTAB-62 data of gene pairs in the All Known and MMM12+ networks. For the known interactions found in MMM12+ (blue solid line), the frequency distribution was found to be skewed toward higher correlations. The overall MMM12+ network distribution had fewer high correlation values (green solid line), particularly when only the subnetwork of NEW clusters was considered (red solid line). When considering all the known interactions, we found higher correlation values when both genes were old (orange dotted line) but significantly less than if the genes were also coevolving (i.e., in MMM12+; blue solid line). Newly interacting genes are less likely to be coexpressed. The distribution of known interactions when one of the genes was “new” (blue and purple dotted lines) was similar to the distribution from the MMM12+NEW network (red solid line).
F<sc>ig</sc>. 5.
Fig. 5.
MMM13+ network of cilia/ciliopathy genes. Subnetwork of cilia/ciliopathy genes and their first neighbors in the MMM13+ network. Teal nodes indicate the cilia/ciliopathy genes. The thickness of the lines to their first neighbors is proportional to the MMM score.
F<sc>ig</sc>. 6.
Fig. 6.
Frequency of mutated genes in ovarian serous cystadenocarcinoma tumors. The count of mutated genes (y axis) found in at least the number of tumor donor samples on the x axis is shown. Genes were annotated as being involved in cilia or ciliopathies (blue diamonds) or grouped by their evolutionary age (red circles for old and green triangles for new) and are black outlined when statistically significant (P < 0.05). (A) The results are for all genes. (B) We only considered genes in the MMM12+ network. The MMM12+OLD genes were never overrepresented in the samples, but the cilia genes were highly overrepresented in the samples, as were the MMM12+NEW genes.
F<sc>ig</sc>. 7.
Fig. 7.
Expression of cilia-related genes in high-grade serous ovarian carcinomas. The average log expression values for the cilia/ciliopathy genes and those not annotated as such (supplementary data set S2, Supplementary Material online) are shown for cancer samples (first 13 samples on the left), normal fallopian epithelial (FTE) cells from BRCA1-mutated donors (middle 12 samples), and normal fallopian epithelial cells from non-BRCA1 donors (rightmost 12 samples; see Tone et al. [2008] for details). Asterisks indicate statistical significance of a two-tailed t-test at *P < 0.05 or **P < 0.01, for significant over- or underexpression of cilia/ciliopathy genes.

References

    1. Alexa A, Rahnenführer J, Lengauer T. Improved scoring of functional groups from gene expression data by decorrelating GO graph structure. Bioinformatics. 2006;22:1600–1607. - PubMed
    1. Altenhoff AM, Schneider A, Gonnet GH, Dessimoz C. OMA 2011: orthology inference among 1000 complete genomes. Nucleic Acids Res. 2011;39:D289–D294. - PMC - PubMed
    1. Bettencourt-Dias M, Hildebrandt F, Pellman D, Woods G, Godinho SA. Centrosomes and cilia in human disease. Trends Genet. 2011;27:307–315. - PMC - PubMed
    1. The Cancer Genome Atlas Research Network. Integrated genomic analyses of ovarian carcinoma. Nature. 2011;474:609–615. - PMC - PubMed
    1. Clark GW, Dar V, Bezginov A, Yang JM, Charlebois RL, Tillier ERM. Using coevolution to predict protein-protein interactions. Methods Mol Biol. 2011;781:237–256. - PubMed

Publication types