

Integrating sequence variation and protein structure to identify sites under selection
- PMID: 22977116
- PMCID: PMC3525147
- DOI: 10.1093/molbev/mss217
Integrating sequence variation and protein structure to identify sites under selection
Abstract
We present a novel method to identify sites under selection in protein-coding genes. Our method combines the traditional Goldman-Yang model of coding-sequence evolution with the information obtained from the 3D structure of the evolving protein, specifically the relative solvent accessibility (RSA) of individual residues. We develop a random-effects likelihood sites model in which rate classes are RSA dependent. The RSA dependence is modeled with linear functions. We demonstrate that our RSA-dependent model provides a significantly better fit to molecular sequence data than does a traditional, RSA-independent model. We further show that our model provides a natural, RSA-dependent neutral baseline for the evolutionary rate ratio ω = dN/dS Sites that deviate from this neutral baseline likely experience selection pressure for function. We apply our method to the influenza proteins hemagglutinin and neuraminidase. For hemagglutinin, our method recovers positively selected sites near the sialic acid-binding site and negatively selected sites that may be important for trimerization. For neuraminidase, our method recovers the oseltamivir resistance site and otherwise suggests that few sites deviate from the neutral baseline. Our method is broadly applicable to any protein sequences for which structural data are available or can be obtained via homology modeling or threading.
Figures

 –RSA plot. Most sites in proteins fall into a trapezoidal region we consider the neutral baseline. Sites with
  are generally considered to be under positive diversifying selection. In addition to such sites, our method can also identify sites with an
  but either larger or smaller than expected given their RSA. These sites fall into the triangular regions below
  that are either above or below the neutral baseline. Sites in these regions experience either an accelerated or a reduced rate of evolution relative to the baseline and are likely to be functionally important.

 AIC values are calculated relative to the overall best model.
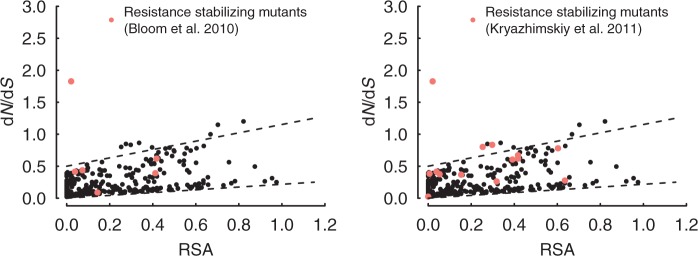
 versus RSA for hemagglutinin, obtained from the optimal model (three slopes and three intercepts). Dashed lines indicate the trapezoidally shaped neutral baseline (as ascertained by eye). Sites highlighted in red are within 8 Å of the sialic acid-binding region. Sites above the upper dashed line are significantly enriched in sites near the sialic acid-binding region (Fisher’s exact test, OR = 6.6,
  ).
).
References
-
- Akaike H. A new look at the statistical model identification. IEEE Trans Automat Contr. 1974;19:716–723.
-
- Azaïs JM, Gassiat E, Mercadier C. The likelihood ratio test for general mixture models with or without structural parameter. ESAIM: Probab Stat. 2009;13:301–327.
-
- Bloom JD, Drummond DA, Arnold FH, Wilke CO. Structural determinants of the rate of protein evolution in yeast. Mol Biol Evol. 2006;23:1751–1761. - PubMed
Publication types
MeSH terms
Substances
Grants and funding
LinkOut - more resources
Full Text Sources
