

The impact of past climate change on genetic variation and population connectivity in the Icelandic arctic fox
- PMID: 22977155
- PMCID: PMC3479732
- DOI: 10.1098/rspb.2012.1796
The impact of past climate change on genetic variation and population connectivity in the Icelandic arctic fox
Abstract
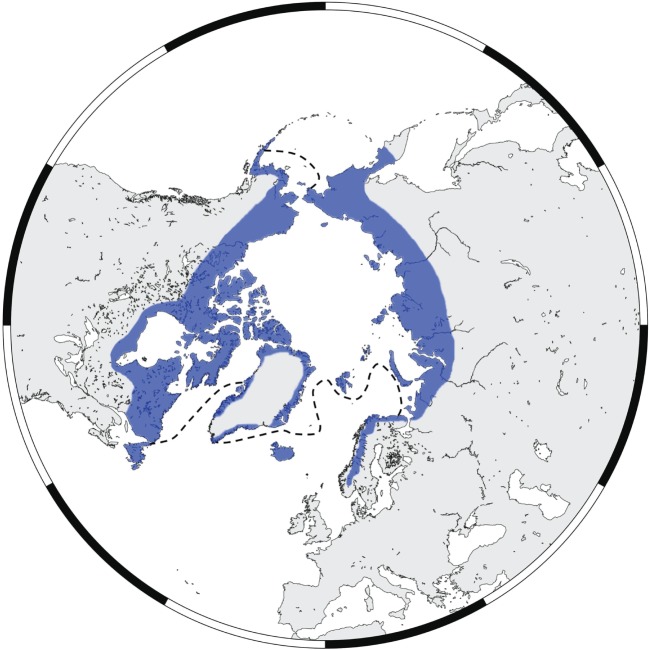
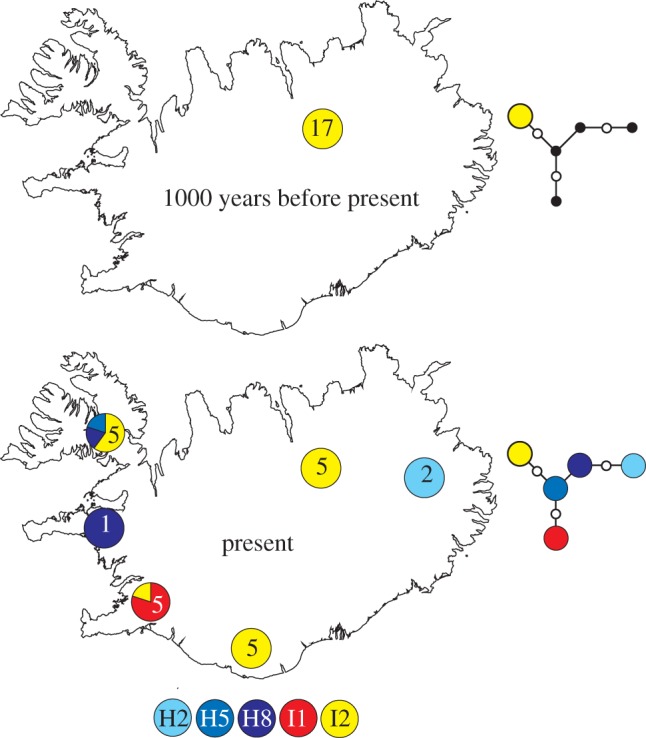
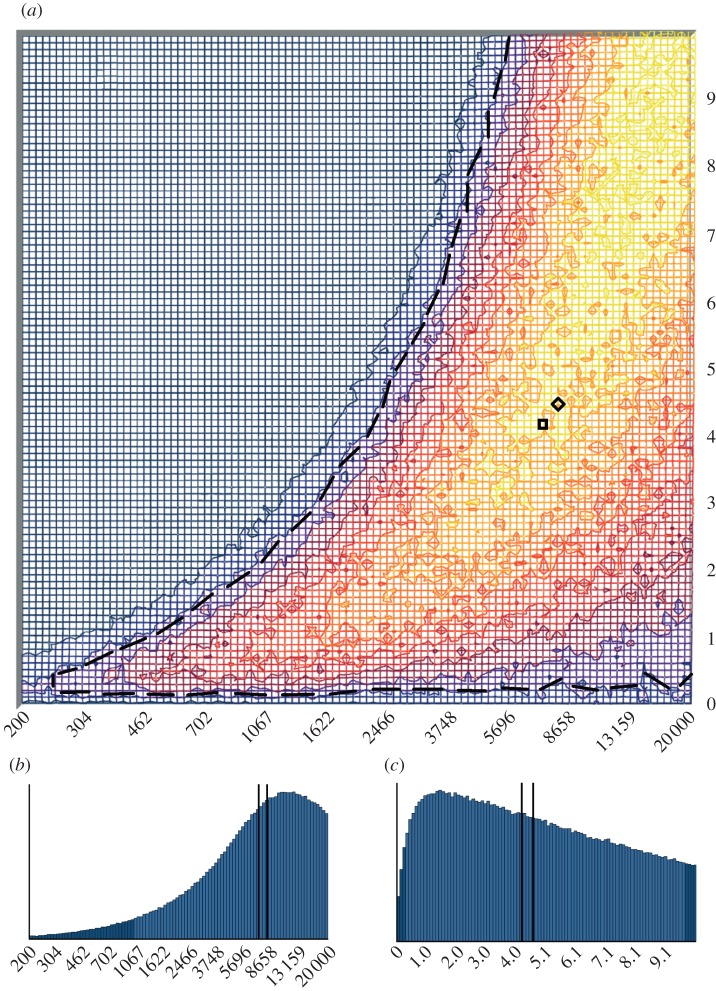
Previous studies have suggested that the presence of sea ice is an important factor in facilitating migration and determining the degree of genetic isolation among contemporary arctic fox populations. Because the extent of sea ice is dependent upon global temperatures, periods of significant cooling would have had a major impact on fox population connectivity and genetic variation. We tested this hypothesis by extracting and sequencing mitochondrial control region sequences from 17 arctic foxes excavated from two late-ninth-century to twelfth-century AD archaeological sites in northeast Iceland, both of which predate the Little Ice Age (approx. sixteenth to nineteenth century). Despite the fact that five haplotypes have been observed in modern Icelandic foxes, a single haplotype was shared among all of the ancient individuals. Results from simulations within an approximate Bayesian computation framework suggest that the rapid increase in Icelandic arctic fox haplotype diversity can only be explained by sea-ice-mediated fox immigration facilitated by the Little Ice Age.
Figures
References
-
- Dugmore A. J., et al. 2005. The Norse landnám on the North Atlantic islands: an environmental impact assessment. Polar Record 41, 21–3710.1017/S0032247404003985 (doi:10.1017/S0032247404003985) - DOI - DOI
-
- Dugmore A. J., Gisladóttir G., Simpson I. A., Newton A. 2009. Conceptual models of 1200 years of Icelandic soil erosion reconstructed using tephrochronology. J. North Atlantic 2, 1–1810.3721/037.002.0103 (doi:10.3721/037.002.0103) - DOI - DOI
-
- Vickers K., Erlendsson E., Church M. J., Edwards K. J., Bending J. 2011. 1000 years of environmental change and human impact at Stóra-Mörk, southern Iceland: a multiproxy study of a dynamic and vulnerable landscape. The Holocene 21, 979–99510.1177/0959683611400201 (doi:10.1177/0959683611400201) - DOI - DOI
-
- Hersteinsson P., Nyström V., Jóhannsson J. H., Guðjónsdóttir B., Hallsdóttir M. 2007. Elstu Þekktu Leifar Melrakka á íslandi. Náttúrufræðingurinn 76, 13–21
-
- Ramakrishnan U., Hadly E. A. 2009. Using phylochronology to reveal cryptic population histories: review and synthesis of 29 ancient DNA studies. Mol. Ecol. 18, 1310–133010.1111/j.1365-294X.2009.04092.x (doi:10.1111/j.1365-294X.2009.04092.x) - DOI - DOI - PubMed
Publication types
MeSH terms
Substances
Associated data
- Actions
- Actions
- Actions
- Actions
- Actions
- Actions
- Actions
- Actions
- Actions
- Actions
- Actions
- Actions
- Actions
- Actions
- Actions
- Actions
- Actions
LinkOut - more resources
Full Text Sources
Medical
Miscellaneous
