. 2012 Nov;40(21):10679-88.
doi: 10.1093/nar/gks855. Epub 2012 Sep 12.

Estrogen-induced upregulation and 3'-UTR shortening of CDC6

Affiliations

Estrogen-induced upregulation and 3'-UTR shortening of CDC6

Begum H Akman et al. Nucleic Acids Res. 2012 Nov.

Abstract

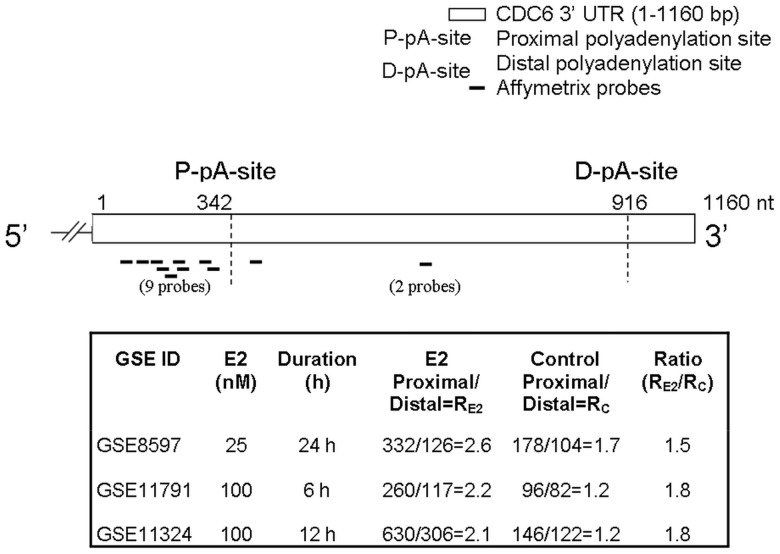
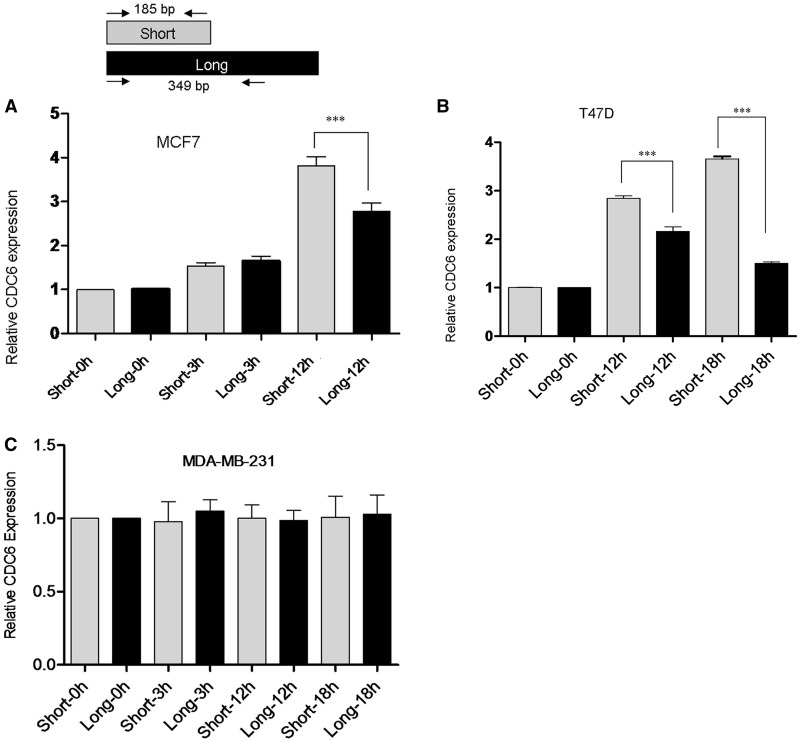
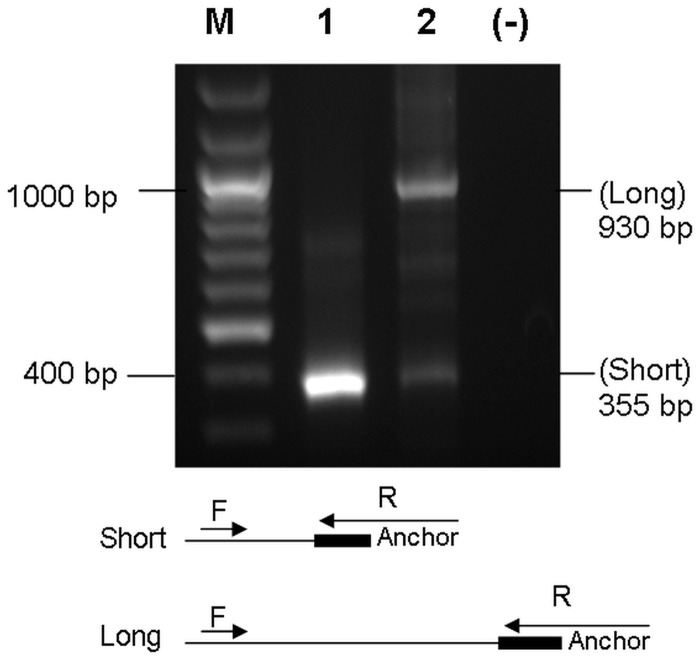
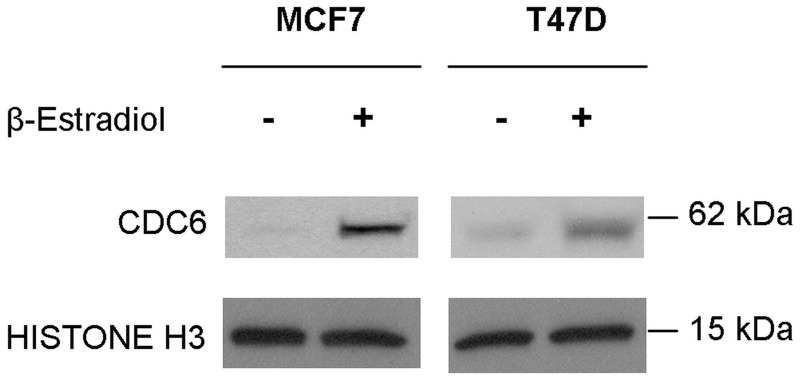
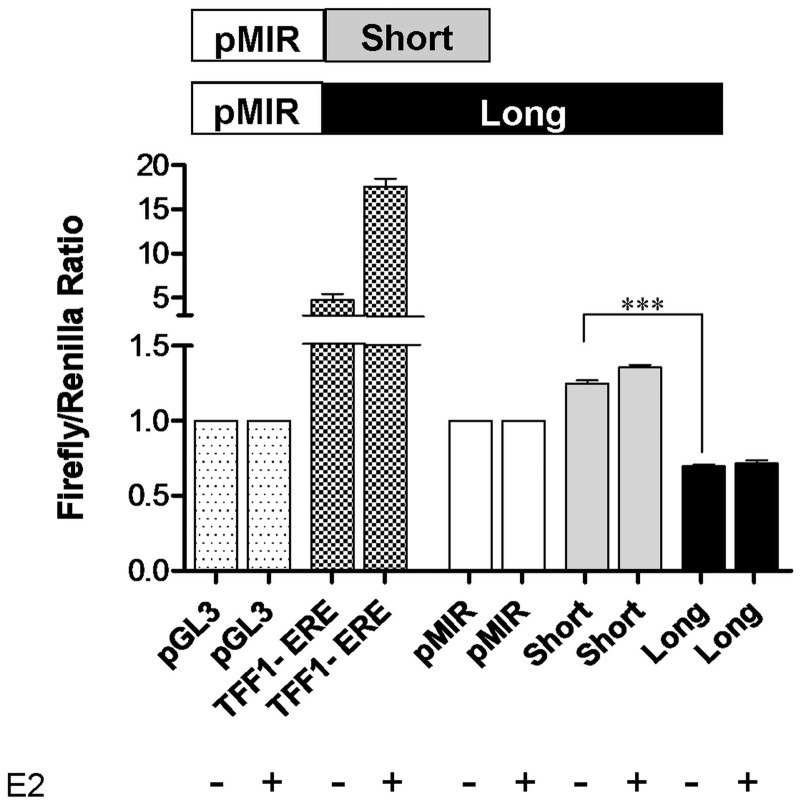
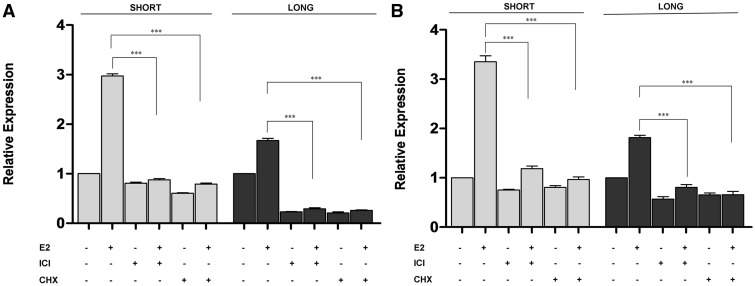
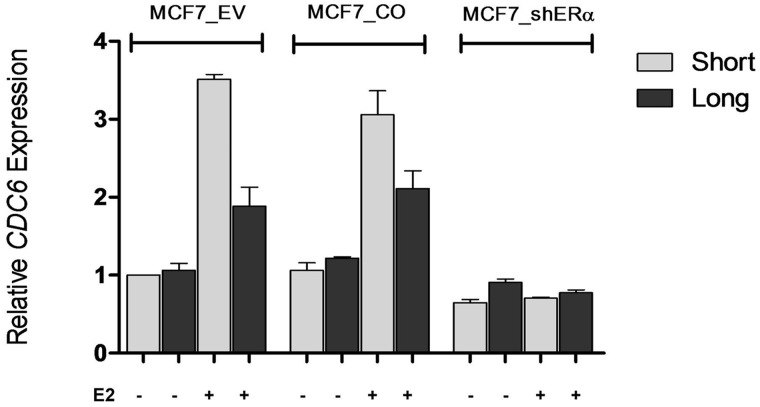
3'-Untranslated region (UTR) shortening of mRNAs via alternative polyadenylation (APA) has important ramifications for gene expression. By using proximal APA sites and switching to shorter 3'-UTRs, proliferating cells avoid miRNA-mediated repression. Such APA and 3'-UTR shortening events may explain the basis of some of the proto-oncogene activation cases observed in cancer cells. In this study, we investigated whether 17 β-estradiol (E2), a potent proliferation signal, induces APA and 3'-UTR shortening to activate proto-oncogenes in estrogen receptor positive (ER+) breast cancers. Our initial probe based screen of independent expression arrays suggested upregulation and 3'-UTR shortening of an essential regulator of DNA replication, CDC6 (cell division cycle 6), upon E2 treatment. We further confirmed the E2- and ER-dependent upregulation and 3'UTR shortening of CDC6, which lead to increased CDC6 protein levels and higher BrdU incorporation. Consequently, miRNA binding predictions and dual luciferase assays suggested that 3'-UTR shortening of CDC6 was a mechanism to avoid 3'-UTR-dependent negative regulations. Hence, we demonstrated CDC6 APA induction by the proliferative effect of E2 in ER+ cells and provided new insights into the complex regulation of APA. E2-induced APA is likely to be an important but previously overlooked mechanism of E2-responsive gene expression.


Figures

Figure 1.
Figure 1.
CDC6 3′-UTR (1160 nucleotides) and the positions of the probes are shown. Nine of the probes matched to the site upstream of the proximal poly(A) (P-pA) site and two of the probes matched to the region between P-pA and distal poly(A) (D-pA) site. P-pA and D-pA are the reported poly(A) sites (16). Three independent gene expression datasets for E2 treatment in MCF7 cells (GSE8597, GSE11791, GSE11324) were analysed at the probe level. The mean of nine proximal and two distal probe set signals were collected. The proximal to distal signal ratio in E2-treated (RE2) MCF7 cells increased at least 1.5× fold compared with the ratios (RC) of the control cells.
Figure 2.
Figure 2.
Relative quantification of CDC6 3′-UTR short and long isoforms in E2-treated and control cells. (A) MCF7 cells were treated with 10 nM E2 for 3 and 12 h. (B) T47D cells were treated with 10 nM E2 for 12 and 18 h. (C) MDA-MB-231 cells were treated with 10 nM E2 for 3, 12 and 18 h. The fold change for the isoforms was normalized against the reference gene, SDHA. Quantification was done using the reaction efficiency correction and ΔΔCq method (29). The baseline for the short and long isoforms in untreated samples was set to 1. ***Indicates significant difference between short and long isoforms’ expression, P < 0.001 (one-way ANOVA followed by Tukey’s multiple comparison test).
Figure 3.
Figure 3.
3′ RACE confirmed the existence of the short isoform. cDNA was synthesized using E2-treated MCF7 total RNA with anchor oligo-dT using the 3′ RACE Kit (Roche Applied Sciences). CDC6 gene-specific forward (F) and anchor-specific reverse (R) primers amplified the expected 355 bp (lane 1, 2) and 930 bp (lane 2) products of the short and the long isoforms after nested 3′ RACE. Three hundred fifty-five base pairs of PCR product in lane 2 corresponding to the short isoform was gel purified and used as a PCR template (lane 1) with the CDC6 forward and R anchor primers. Sequencing of this product (lane 1) verified the presence of the poly(A) tail. M: DNA ladder, (−): No template reaction.
Figure 4.
Figure 4.
E2 treatment caused increase of the CDC6 protein levels. MCF7 and T47D nuclear lysates were collected followed by 10 nM E2 treatment for 12 and 18 h, respectively. Histone H3 antibody was used as a nuclear protein loading control.
Figure 5.
Figure 5.
Dual luciferase reporter assay. CDC6 short and long 3′-UTRs were cloned into the 3′-UTR of Firefly luciferase gene in pMIR. pMIR–short, pMIR–long and pMIR–empty vectors were co-transfected with phRL–TK into MCF7 cells. MCF7 cells were kept in phenol red-free medium supplemented with 10% charcoal-stripped FBS for 48 h. Twelve hours post-transfection, E2 was applied to a final concentration of 10 nM for 12 h. E2 responsive TFF1-promoter construct was used as a positive control for E2 treatment. pGL3 is the empty vector, TFF1-ERE (in pGL3) harbors the promoter and E2-responsive regions of the TFF1 gene. Dual-luciferase assay was performed 24 h after transfection. Firefly/Renilla luciferase read-outs from the constructs were normalized to that of empty pMIR, which was set to 1. ***Indicates P < 0.001 (one-way ANOVA followed by Tukey’s multiple comparison test).
Figure 6.
Figure 6.
E2-induced CDC6 expression requires ER and de novo protein synthesis. (A) MCF7 and (B) T47D cells were grown in phenol red-free medium supplemented with 10% dextran-coated-charcoal stripped FBS, pre-treated with 1 µM ICI or with 10 µg/mL CHX (Cycloheximide) for 1 h, then with 10 nM E2 for 12 h. Relative expression of CDC6 short (gray bars) and long (black bars) isoforms was determined by RT-qPCR. The baseline for the control-treated samples was set to 1. ***Indicates statistical significance (P < 0.001).
Figure 7.
Figure 7.
E2 does not induce CDC6 3′-UTR isoform increase in ER-silenced MCF7 cells. Cells were treated with E2 as described earlier. Relative quantification of CDC6 3′-UTR short and long isoforms was determined in MCF7-EV (empty vector transfected), MCF7_CO (control shRNA transfected) and in MCF7_shERα cells before and after 12 h of E2 treatment. The fold change for the isoforms was normalized against the reference gene, SDHA. Quantification was done using the reaction efficiency correction and ΔΔCq method (29). The baseline for the short and long isoforms in untreated samples was set to 1.

References

    1. Lutz CS, Moreira A. Alternative mRNA polyadenylation in eukaryotes: an effective regulator of gene expression. Wiley Interdiscip. Rev. RNA. 2011;2:23–31. - PMC - PubMed
    1. Lutz CS. Alternative polyadenylation: a twist on mRNA 3′ end formation. ACS Chem. Biol. 2008;3:609–617. - PubMed
    1. Tian B, Hu J, Zhang H, Lutz CS. A large-scale analysis of mRNA polyadenylation of human and mouse genes. Nucleic Acids Res. 2005;33:201–212. - PMC - PubMed
    1. Ara T, Lopez F, Ritchie W, Benech P, Gautheret D. Conservation of alternative polyadenylation patterns in mammalian genes. BMC Genomics. 2006;7:189. - PMC - PubMed
    1. Xing D, Li QQ. Alternative polyadenylation: a mechanism maximizing transcriptome diversity in higher eukaryotes. Plant Signal. Behav. 2009;4:440–442. - PMC - PubMed

Publication types