. 2012 Oct 26;287(44):36864-72.
doi: 10.1074/jbc.M112.401067. Epub 2012 Sep 13.

Conformational transitions underlying pore opening and desensitization in membrane-embedded Gloeobacter violaceus ligand-gated ion channel (GLIC)

Affiliations

Conformational transitions underlying pore opening and desensitization in membrane-embedded Gloeobacter violaceus ligand-gated ion channel (GLIC)

Phanindra Velisetty et al. J Biol Chem. .

Abstract

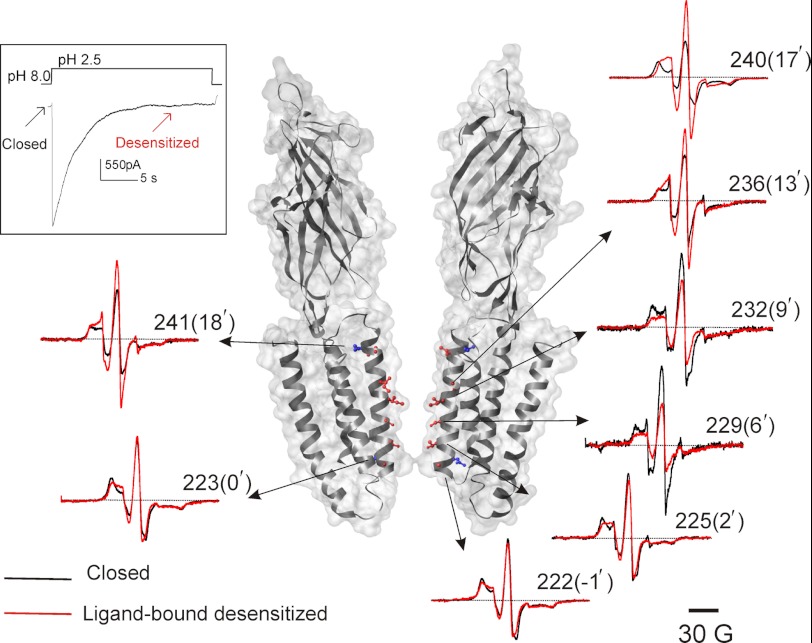
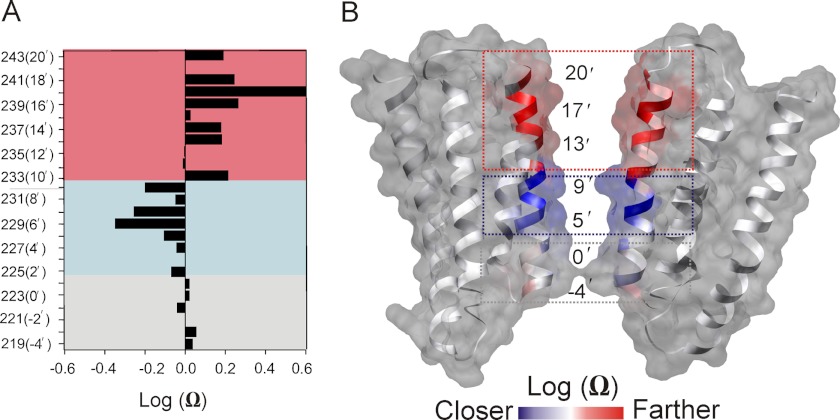
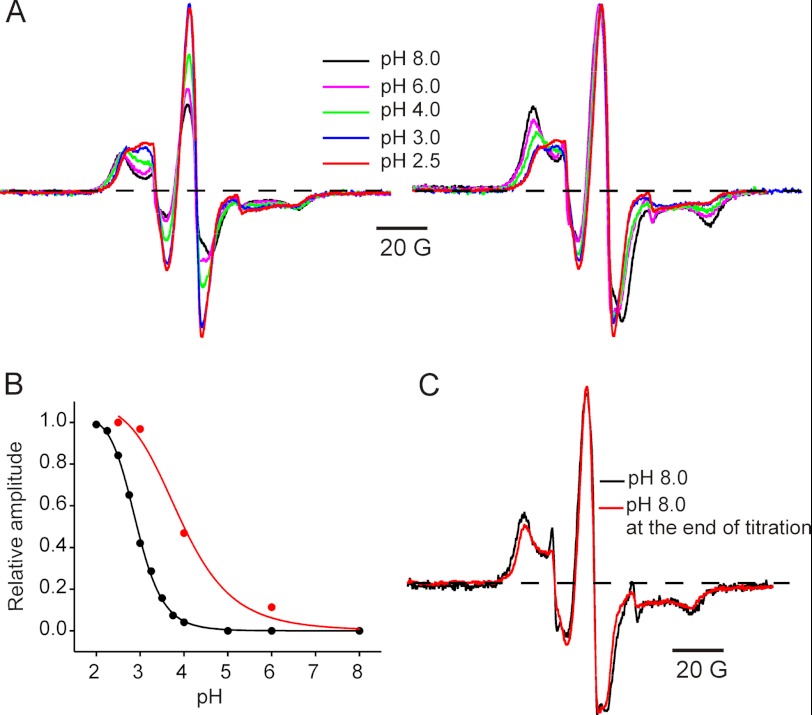
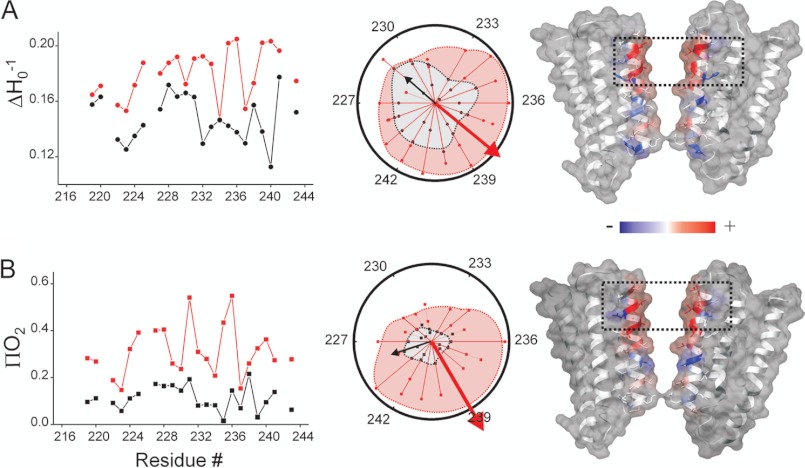
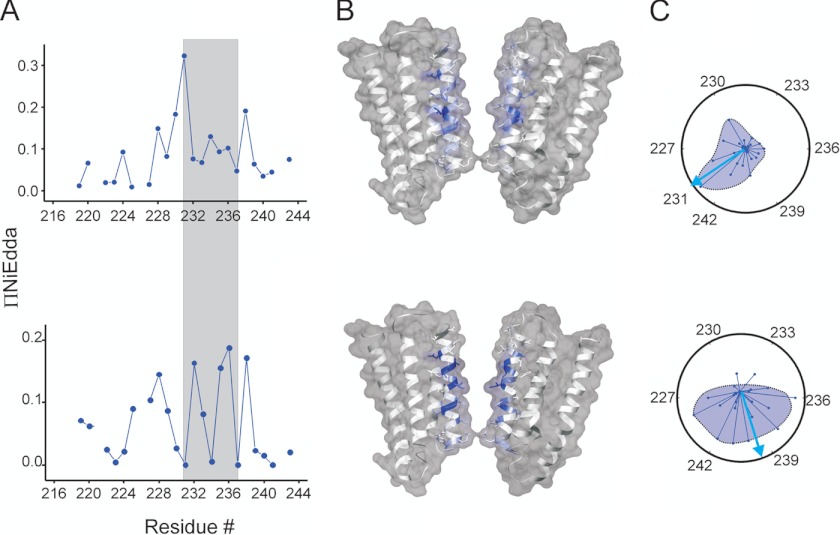
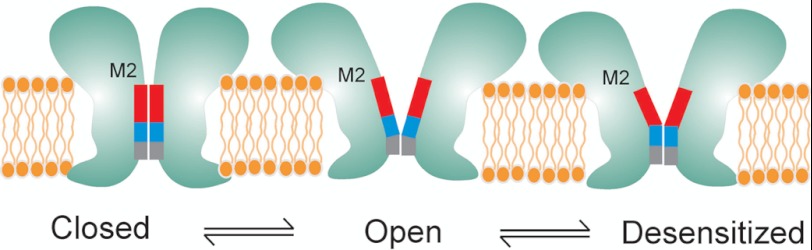
Direct structural insight into the mechanisms underlying activation and desensitization remain unavailable for the pentameric ligand-gated channel family. Here, we report the structural rearrangements underlying gating transitions in membrane-embedded GLIC, a prokaryotic homologue, using site-directed spin labeling and electron paramagnetic resonance (EPR) spectroscopy. We particularly probed the conformation of pore-lining second transmembrane segment (M2) under conditions that favor the closed and the ligand-bound desensitized states. The spin label mobility, intersubunit spin-spin proximity, and the solvent-accessibility parameters in the two states clearly delineate the underlying protein motions within M2. Our results show that during activation the extracellular hydrophobic region undergoes major changes involving an outward translational movement, away from the pore axis, leading to an increase in the pore diameter, whereas the lower end of M2 remains relatively immobile. Most notably, during desensitization, the intervening polar residues in the middle of M2 move closer to form a solvent-occluded barrier and thereby reveal the location of a distinct desensitization gate. In comparison with the crystal structure of GLIC, the structural dynamics of the channel in a membrane environment suggest a more loosely packed conformation with water-accessible intrasubunit vestibules penetrating from the extracellular end all the way to the middle of M2 in the closed state. These regions have been implicated to play a major role in alcohol and drug modulation. Overall, these findings represent a key step toward understanding the fundamentals of gating mechanisms in this class of channels.


Figures

FIGURE 1.
FIGURE 1.
Structural rearrangement underlying channel activation and desensitization. GLIC activates in response to extracellular low pH pulses and undergoes desensitization under prolonged exposure (inset). Representative continuous wave-EPR spectra of positions in M2 are shown displaying changes in amplitude and line shapes in response to pH changes. Black and red traces were obtained from channels in the closed (pH 8.0) and in the desensitized conformation (pH 2.5), respectively. In each case, the spectra are normalized to the total number of spin. Spin-labeled positions are highlighted by CPK presentation, with residues facing the pore shown in red and those facing away from the pore shown in blue. Only two subunits are shown for clarity.
FIGURE 2.
FIGURE 2.
Changes in the spin label proximity during gating. A, profile of changes in the amplitude of the EPR signal reflecting differences in the spin-spin dipolar coupling in the closed and desensitized conformation. For positions with log Ω < 0, the proximity between individual spin labels increases as the side chains get closer toward the pore axis and for log Ω > 0, the spin labels move away from the pore axis and further apart from each other. In each case, the same sample is used for both closed and desensitized state measurements. B, the log Ω parameter mapped on to the GLIC crystal structure. Residues displayed in red and blue show positive and negative log Ω values, respectively. Residues colored in white show values closer to 0. The boxed areas highlight regions moving away, getting closer and regions of no significant movement.
FIGURE 3.
FIGURE 3.
pH-dependent conformational changes at the activation gate monitored by position 240 movements. A, EPR line shapes obtained after sequentially equilibrating the sample with the indicated pH starting with pH 8.0. In each case, the spectra are normalized to the number of spin. B, pH dependence of EPR signal amplitude (red) overlaid with the pH dependence of the maximal peak response from macroscopic current measurements (black). The pKa of maximal response are 3.9 + 0.2 and 2.9 + 0.1 for the EPR and current measurements, respectively. C, samples were returned to pH 8.0 at the end of sequential pH change. Overlapping spectra shows reversibility of the spectral line shapes.
FIGURE 4.
FIGURE 4.
Changes in the residue enviromental parameters. A, mobility ΔHo−1. B, O2 accessibility ΠO2 for the closed (black) and desensitized (red) states. Shown is the profile of changes in the enviromental parameters for the M2 residues (left). Shown is a helical wheel representation of the mobility and accessibility superimposed in a polar coordinate (middle). The resultant vector of the individual ΔHo−1 or ΠO2 values points toward the more mobile or solvent accessible face of the helix. The shaded area within the dashed lines highlights the projection for complete set of accessibility data relative to the maximal accessibility vector. Fractional differences (normalized to the maximum value measured within each data set) in the ΔHo−1 and ΠO2 values for the closed and desensitized states mapped on the GLIC structure and color coded, with red denoting an increase and blue representing a decrease in the environmental parameter (right).
FIGURE 5.
FIGURE 5.
Aqueous vestibules in the closed and in the desensitized states. A, ΠNiEDDA values for the M2 residues in the closed (top) and desensitized states (bottom). The gray boxed area highlights regions of maximal change between the two states. B, ΠNiEDDA values mapped on the GLIC structure reveals differences in the solvent accessible vestibules in the two conformations. C, changes in the ΠNiEDDA moment during gating conformational change.
FIGURE 6.
FIGURE 6.
Schematic representation of speculative gating motions in M2 during transitions between closed, open, and desensitized conformations. The blocks represent the hydrophobic (red), the polar (blue), and the charged selectivity filter region (gray).

References

    1. Tasneem A., Iyer L. M., Jakobsson E., Aravind L. (2005) Identification of the prokaryotic ligand-gated ion channels and their implications for the mechanisms and origins of animal Cys-loop ion channels. Genome Biol. 6, R4. - PMC - PubMed
    1. Hilf R. J., Dutzler R. (2009) Structure of a potentially open state of a proton-activated pentameric ligand-gated ion channel. Nature 457, 115–118 - PubMed
    1. Hilf R. J., Dutzler R. (2008) X-ray structure of a prokaryotic pentameric ligand-gated ion channel. Nature 452, 375–379 - PubMed
    1. Bocquet N., Nury H., Baaden M., Le Poupon C., Changeux J. P., Delarue M., Corringer P. J. (2009) X-ray structure of a pentameric ligand-gated ion channel in an apparently open conformation. Nature 457, 111–114 - PubMed
    1. Bocquet N., Prado de Carvalho L., Cartaud J., Neyton J., Le Poupon C., Taly A., Grutter T., Changeux J. P., Corringer P. J. (2007) A prokaryotic proton-gated ion channel from the nicotinic acetylcholine receptor family. Nature 445, 116–119 - PubMed