

The effect of induced visual stress on three dimensional perception
- PMID: 22977386
- PMCID: PMC3438004
The effect of induced visual stress on three dimensional perception
Abstract
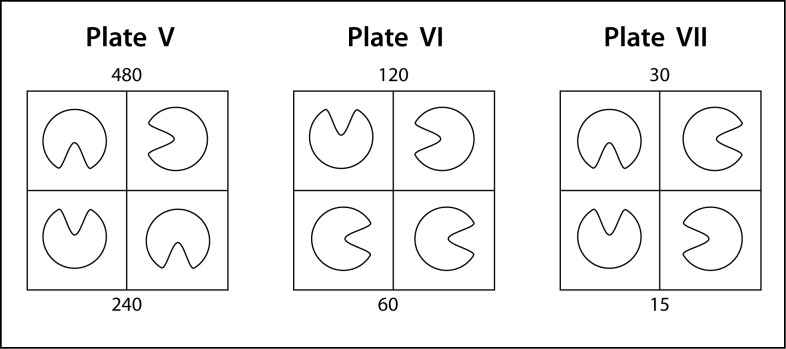
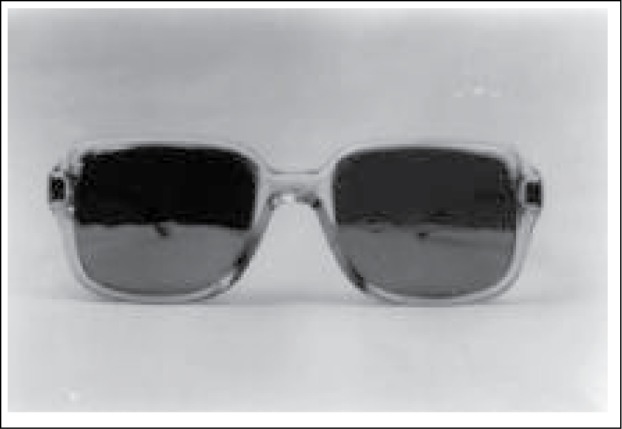
Previous studies have shown that stress on the vergence and accommodation systems, either artificially induced or naturally occurring, results in small misalignment of the visual axes, reduces binocular visual acuity and produces symptoms of ocular discomfort. This study examines the effect of artificially induced visual stress using ophthalmic prisms on three dimensional perception on 30 optometry students ages ranging from 19 to 29 years old. 6D base-in prisms, equally divided between the eyes (3D base-in each) was used to induce stress on the visual system producing misalignment of visual axes known as fixation disparity. The fixation disparity is quantified using near vision Mallett Unit and an enlarged scaled diagram. Stereoscopic perception was measured with the TNO test, with and without the presence of stress and the results was compared. Wilcoxon's matched pair ranked tests show statistically significant difference in the stereo thresholds of both conditions, p = 0.01 for advancing stereopsis and p = 0.01 for receding stereopsis, respectively. The study concludes that visual stress induced by prisms, produce misalignment of the visual axes and thus reduces three dimensional performance.
Keywords: prism induced; stereoacuity; stereopsis; visual stress.
Figures


Similar articles
-
The Effect of Clinical Visual Stress on Stereoacuity Measured with the TNO Test.Malays J Med Sci. 2001 Jul;8(2):25-31. Malays J Med Sci. 2001. PMID: 22893757 Free PMC article.
-
The Mallett Fixation Disparity Test: influence of test instructions and relationship with symptoms.Ophthalmic Physiol Opt. 2006 Sep;26(5):507-22. doi: 10.1111/j.1475-1313.2006.00385.x. Ophthalmic Physiol Opt. 2006. PMID: 16918777
-
Stereoacuity versus fixation disparity as indicators for vergence accuracy under prismatic stress.Ophthalmic Physiol Opt. 2003 Jan;23(1):43-9. doi: 10.1046/j.1475-1313.2003.00089.x. Ophthalmic Physiol Opt. 2003. PMID: 12535056
-
Behavioral studies of local stereopsis and disparity vergence in monkeys.Vision Res. 1995 Jun;35(12):1755-70. doi: 10.1016/0042-6989(94)00256-l. Vision Res. 1995. PMID: 7660583
-
Analysis of binocular visual function using tests made under binocular conditions.Am J Optom Physiol Opt. 1987 Apr;64(4):227-40. doi: 10.1097/00006324-198704000-00001. Am J Optom Physiol Opt. 1987. PMID: 3296766 Review.
Cited by
-
The effect of convergence and divergence stress on near stereoacuity.Int Ophthalmol. 2017 Feb;37(1):165-168. doi: 10.1007/s10792-016-0248-x. Epub 2016 May 9. Int Ophthalmol. 2017. PMID: 27160272
-
The Effect of Clinical Visual Stress on Stereoacuity Measured with the TNO Test.Malays J Med Sci. 2001 Jul;8(2):25-31. Malays J Med Sci. 2001. PMID: 22893757 Free PMC article.
-
Appropriate Image Selection With Virtual Reality in Vestibular Rehabilitation: Cross-sectional Study.JMIR Serious Games. 2023 Apr 13;11:e40806. doi: 10.2196/40806. JMIR Serious Games. 2023. PMID: 37052976 Free PMC article.
-
Influence of Artificially Generated Interocular Blur Difference on Fusion Stability Under Vergence Stress.J Eye Mov Res. 2019 Sep 11;12(4):10.16910/jemr.12.4.4. doi: 10.16910/jemr.12.4.4. J Eye Mov Res. 2019. PMID: 33828740 Free PMC article.
References
-
- Sheedy JE. Fixation disparity analysis of oculomotor imbalance. Am. J. Optom. Physiol. Opt. 1980;57:632–39. - PubMed
-
- Pardhan S, Gilchrist J. The effect of monocular defocus on binocular contras sensitivity. Ophthal. Physiol. Opt. 1990;11:33–6. - PubMed
-
- Pickwell LD, Jenkins TCA, Yekta AA. The effect of fixation disparity and associated ‘phoria of reading at an abnormally close distance. Ophthal. Physiol. Opt. 1987;7:345–47. - PubMed
-
- Pickwell LD, Yekta AA, Jenkins TCA. Effect of reading in low illumination on fixation disparity. Am. J. Optom. Physiol. Opt. 1987;61:513–18. - PubMed
-
- Sheedy JE, Saladin JJ. Association of symptoms with measures of oculomotor deficiencies. Am. J. Physiol. Opt. 1978;55:670–76. - PubMed
LinkOut - more resources
Full Text Sources