. 2011 May;2(3):529-535.
doi: 10.3892/etm.2011.216. Epub 2011 Feb 14.

Thalidomide and irradiation combination therapy increases substance P levels in vitro

Affiliations

Thalidomide and irradiation combination therapy increases substance P levels in vitro

Ece Şimşek Oz et al. Exp Ther Med. 2011 May.

Abstract

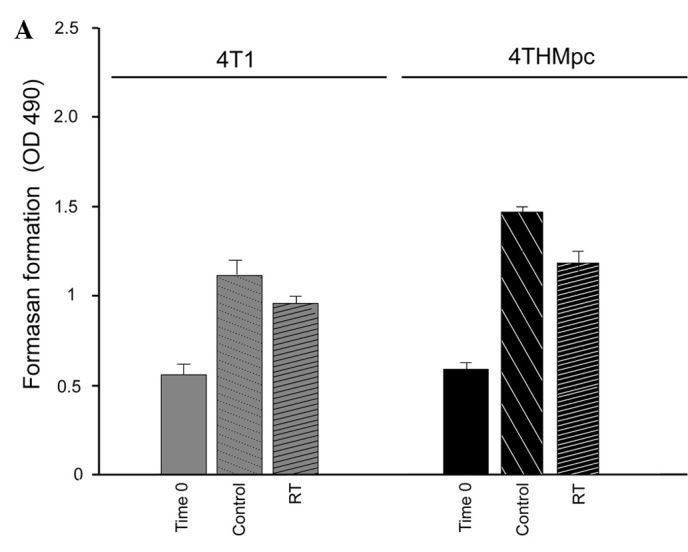
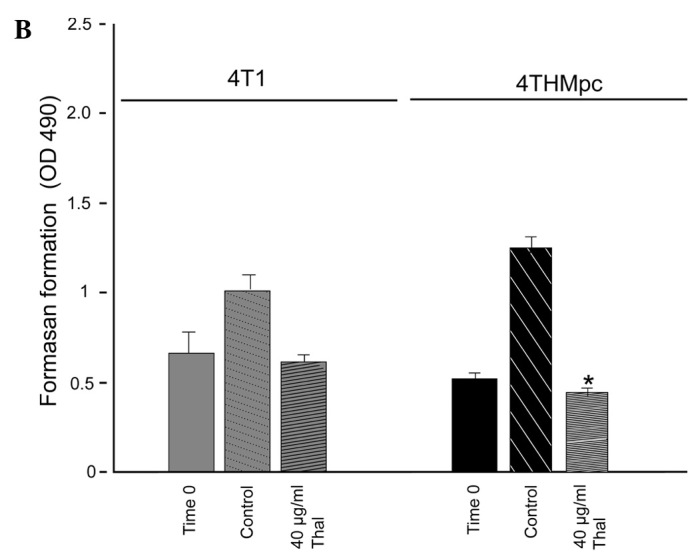
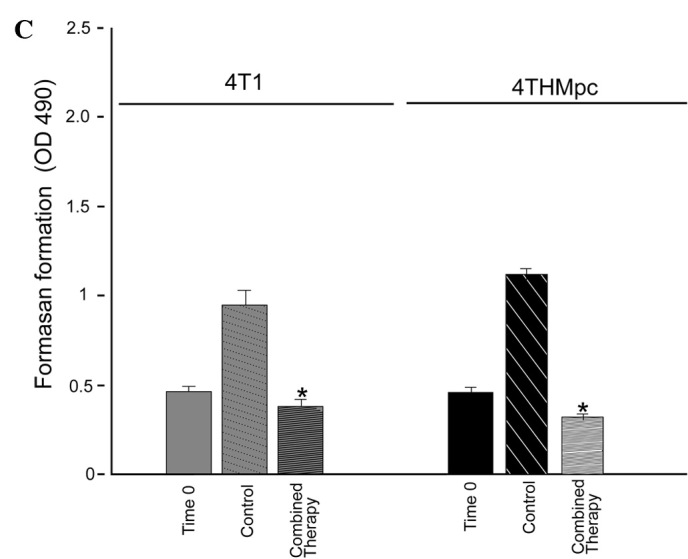
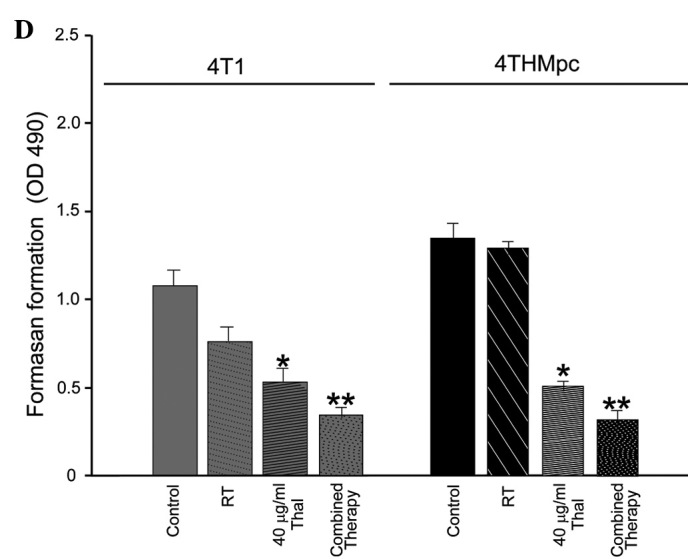
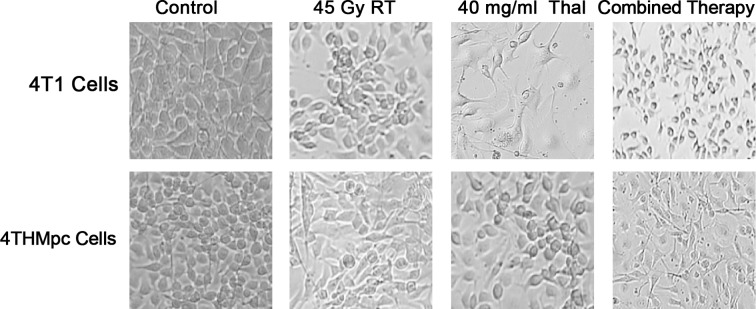
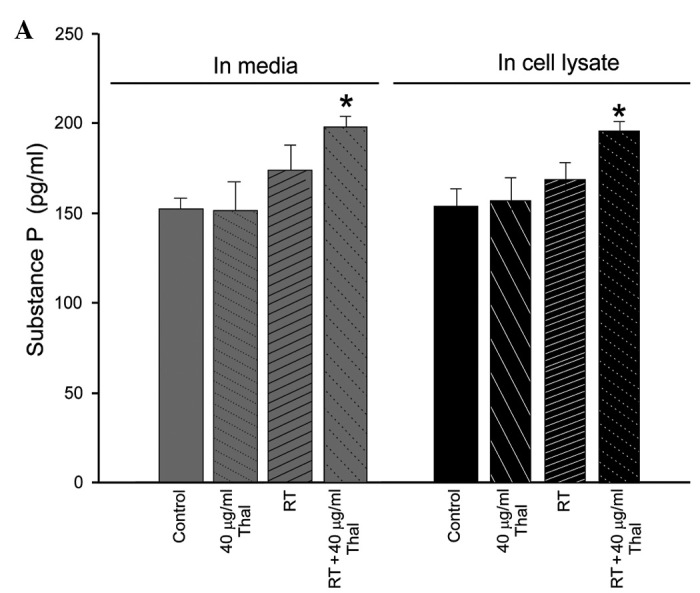
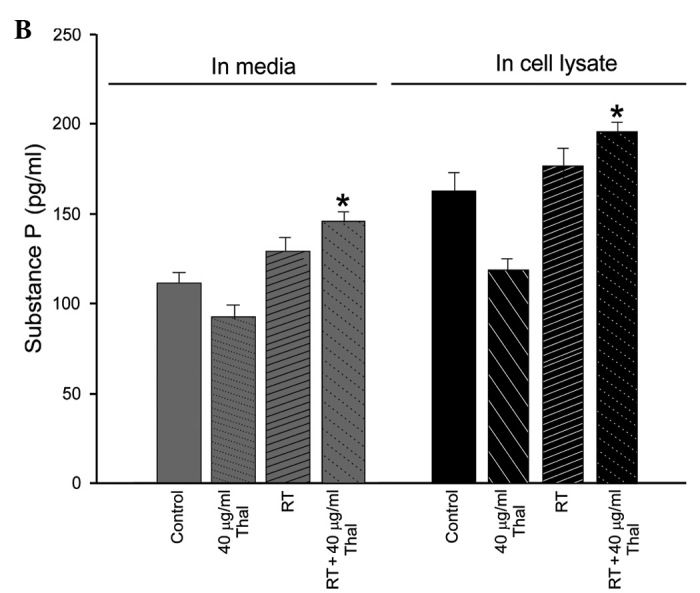
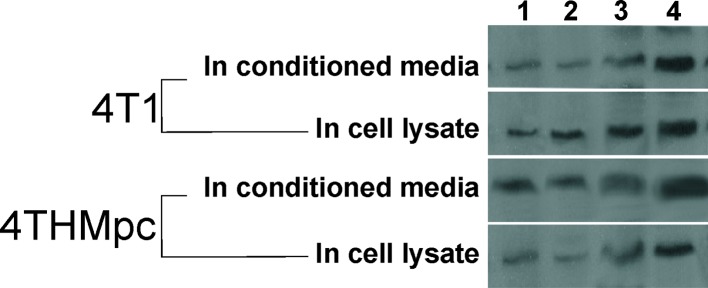
Thalidomide is an anti-angiogenic agent that is used in the treatment of cancer. However, in many cases, particularly in patients with breast cancer, thalidomide treatment alone is insufficient and must be combined with other drugs or therapies. In the clinical setting, thalidomide is most commonly used in combination with radiation therapy. However, the exact mechanisms of its effect are unkown. Radiotherapy alters the expression of substance P, which is considered a crucial pro-angiogenic peptide. To determine whether thalidomide and radiotherapy in combination overcome the limitations of each as monotherapy, we examined the effects of the combination on the growth of breast cancer cells as well as on the expression of substance P in vitro. Mouse breast cancer cells (4T1) and cells produced from metastatic lesions (4THMpc) were treated with radiotherapy (RT) (45 Gy) alone, thalidomide (Thal) (40 μg/ml) alone or combination therapy (40 μg/ml Thal + 45 Gy RT), and compared with control cells. MTS, Live/Dead and trypan blue exclusion assays were used to evaluate the cytotoxic effects of the treatments. The levels of substance P in the conditioned media and in the cell lysates were determined by a substance P ELISA kit, and changes in the protein content were analyzed by Western blotting. Thalidomide alone resulted in a significant inhibition in the growth of the 4T1 (34.1%) and 4THMpc (52.6%) cell lines. RT alone inhibited the growth of the 4T1 (19.2%) and 4THMpc (23.31%) cell lines. The combination therapy enhanced the growth inhibition noted in the 4T1 (47.9%) and 4THMpc (62.03%) cell lines. The expression of substance P in the conditioned media and in the cell lysates increased within 72 h of RT. This increase was significantly enhanced with the combination therapy. These data indicate that thalidomide inhibits breast cancer cell growth and potentiates the anti-tumor effects of radiation at appropriate doses.


Figures

Figure 1.
Figure 1.
Effect of radiotherapy (RT), thalidomide (Thal) and combination therapy (Thal + RT) on cell growth in vitro in the 4T1 and 4THMpc cell lines, determined 72 h after treatment using the MTS assay. (A) Cells treated with 45 Gy of ionizing radiation alone. (B) Cells treated with 40 μg/ml Thal alone. (C) Cells first treated with 40 μg/ml Thal, then after 4 h with 45 Gy ionizing radiation. Time 0 indicates the cell numbers immediately before treatment. (D) Comparison of the effects of RT and Thal on cell viability, either alone or in combination. *p<0.05, significantly different as compared to the control group; Student’s t-test.
Figure 1.
Figure 1.
Effect of radiotherapy (RT), thalidomide (Thal) and combination therapy (Thal + RT) on cell growth in vitro in the 4T1 and 4THMpc cell lines, determined 72 h after treatment using the MTS assay. (A) Cells treated with 45 Gy of ionizing radiation alone. (B) Cells treated with 40 μg/ml Thal alone. (C) Cells first treated with 40 μg/ml Thal, then after 4 h with 45 Gy ionizing radiation. Time 0 indicates the cell numbers immediately before treatment. (D) Comparison of the effects of RT and Thal on cell viability, either alone or in combination. *p<0.05, significantly different as compared to the control group; Student’s t-test.
Figure 2.
Figure 2.
Effects of thalidomide (Thal), radiotherapy (RT) and combination therapy on cell growth. Cells were seeded at 50,000 cells/well in 12 well-plates, and the number of live cells was determined by the trypan blue exclusion assay. Images were captured under a phase contrast microscope.
Figure 3.
Figure 3.
Effects of thalidomide (Thal), radiotherapy (RT) and combination therapy on SP levels in vitro, determined 72 h after treatment in conditioned media and cell lysates from (A) 4T1 and (B) 4THMpc cells. *p<0.05, significant difference in SP level as compared to the control group; Student’s t-test.
Figure 3.
Figure 3.
Effects of thalidomide (Thal), radiotherapy (RT) and combination therapy on SP levels in vitro, determined 72 h after treatment in conditioned media and cell lysates from (A) 4T1 and (B) 4THMpc cells. *p<0.05, significant difference in SP level as compared to the control group; Student’s t-test.
Figure 4.
Figure 4.
Amount of SP in the conditioned media and in the cell lysates in vitro. SP was immunoprecipitated and then characterized by Western blotting. Molecular weights of the visualized bands were ∼3 kDa as compared to the marker.

Similar articles

Cited by

References

    1. Polyak K. On the birth of breast cancer. Biochim Biophys Acta. 2001;1552:1–13. - PubMed
    1. Goss PE. Breast cancer prevention – clinical trials strategies involving aromatase inhibitors. J Steroid Biochem Mol Biol. 2003;86:487–493. - PubMed
    1. Dong X, Han ZC, Yang R. Angiogenesis and antiangiogenic therapy in hematologic malignancies. Crit Rev Oncol Hematol. 2007;62:105–118. - PubMed
    1. Schneider BP, Miller KD. Angiogenesis of breast cancer. J Clin Oncol. 2005;23:1782–1790. - PubMed
    1. Nishida N, Yaho H, Nishida T, Kamura T, Kojiro M. Angiogenesis in cancer. Vasc Health Risk Manag. 2006;2:213–219. - PMC - PubMed

LinkOut - more resources