

Altered characteristics of cancer stem/initiating cells in a breast cancer cell line treated with persistent 5-FU chemotherapy
- PMID: 22977582
- PMCID: PMC3440734
- DOI: 10.3892/etm.2011.279
Altered characteristics of cancer stem/initiating cells in a breast cancer cell line treated with persistent 5-FU chemotherapy
Abstract
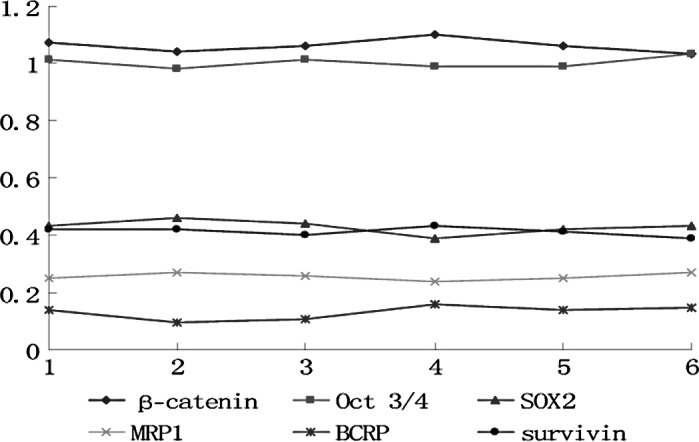
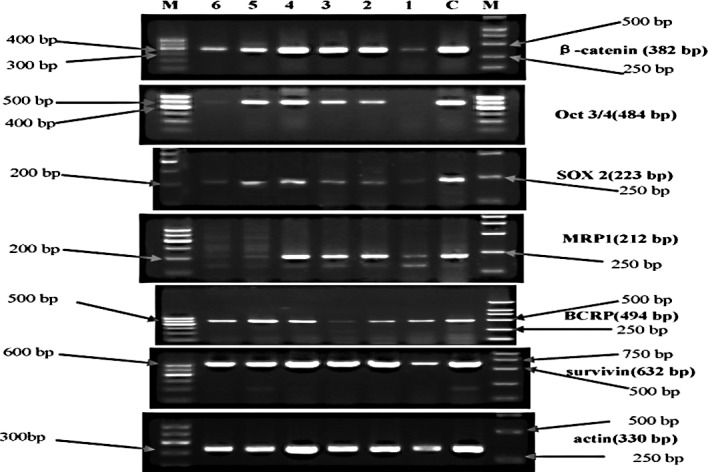
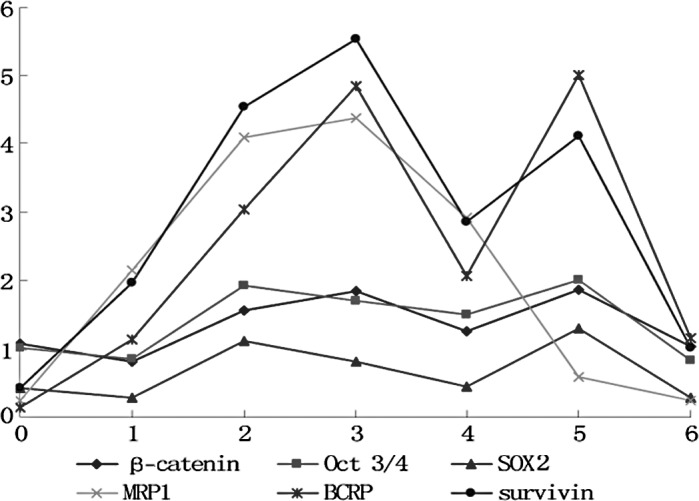
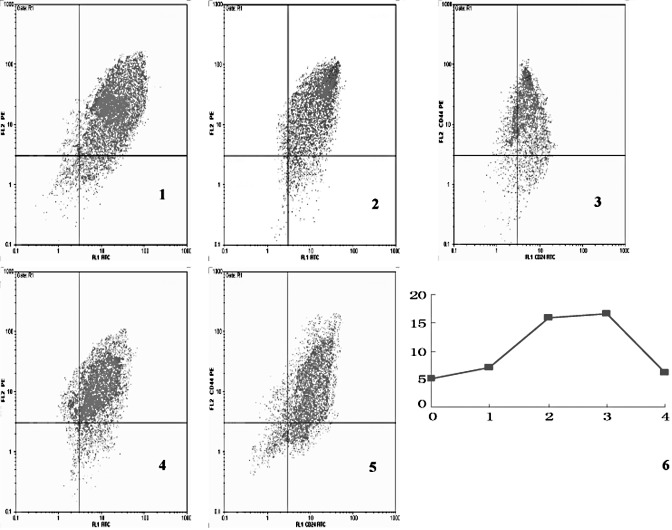
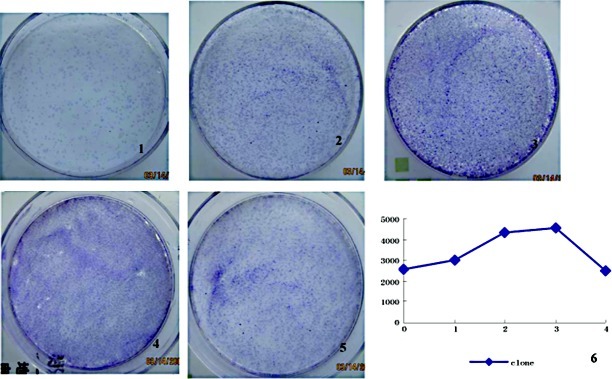
Drug resistance of cancer stem/initiating cells has been considered to be one of the main reasons for tumor relapse. However, knowledge concerning the changes in stem/ initiating cells during chemotherapy is limited. In the present study, the breast cancer cell line MDA-MB-468 was cultured with 5-fluorouracil and serially passaged. Six cell generations were collected. Semi-quantitative RT-PCR and flow cytometric techniques were used to evaluate the protein and mRNA expression of stem/initiating factors (CD44(+)/CD24(-), Oct 3/4, SOX2 and β-catenin), drug-resistance genes (BCRP and MRP1) and an anti-apoptosis gene (survivin). The clone formation rate was also examined in every generation of cells. The results showed that, under conditions of persistent chemotherapy, the factors representing the quantity of stem/initiating cells (β-catenin, Oct 3/4 and SOX2) followed a fluctuating trend of decrease-increase-further increase-decrease-increase-decrease, and factors representing the proportion of stem/initiating cells (proportion of CD44(+)/CD24(-) and the clone formation rate) demonstrated a fluctuating trend of increase-further increase-further increase-decrease. The drug-resistance genes (BCRP and MRP1) and the anti-apoptosis gene (survivin) demonstrated a wave of increase-further increase-further increase-decrease-increase (MRP1 decrease)-decrease. β-catenin, Oct 3/4 and SOX2 showed a positive correlation (r=1, p<0.01). Our study confirmed that the drug resistance of cancer cells is mainly due to tumor stem/initiating cells, and that under conditions of persistent chemotherapy, the quantity or function of breast cancer stem/initiating cells increases and decreases alternately.
Figures
References
-
- Eramo A, Ricci-Vitiani L, Zeuner A, et al. Chemotherapy resistance of glioblastoma stem cells. Cell Death Differ. 2006;13:1238–1241. - PubMed
-
- Phillips TM, McBride WH, Pajonk F. The response of CD24(−/low)/CD44+ breast cancer-initiating cells to radiation. J Natl Cancer Inst. 2006;98:1777–1785. - PubMed
-
- Tanei T, Morimoto K, Shimazu K, et al. Association of breast cancer stem cells identified by aldehyde dehydrogenase 1 expression with resistance to sequential paclitaxel and epirubicin-based chemotherapy for breast cancers. Clin Cancer Res. 2009;15:4234–4241. - PubMed
-
- Dean M, Fojo T, Bates S. Tumour stem cells and drug resistance. Nat Rev Cancer. 2005;5:275–284. - PubMed
LinkOut - more resources
Full Text Sources
Miscellaneous