

Disentangling evolutionary signals: conservation, specificity determining positions and coevolution. Implication for catalytic residue prediction
- PMID: 22978315
- PMCID: PMC3515339
- DOI: 10.1186/1471-2105-13-235
Disentangling evolutionary signals: conservation, specificity determining positions and coevolution. Implication for catalytic residue prediction
Abstract
Background: A large panel of methods exists that aim to identify residues with critical impact on protein function based on evolutionary signals, sequence and structure information. However, it is not clear to what extent these different methods overlap, and if any of the methods have higher predictive potential compared to others when it comes to, in particular, the identification of catalytic residues (CR) in proteins. Using a large set of enzymatic protein families and measures based on different evolutionary signals, we sought to break up the different components of the information content within a multiple sequence alignment to investigate their predictive potential and degree of overlap.
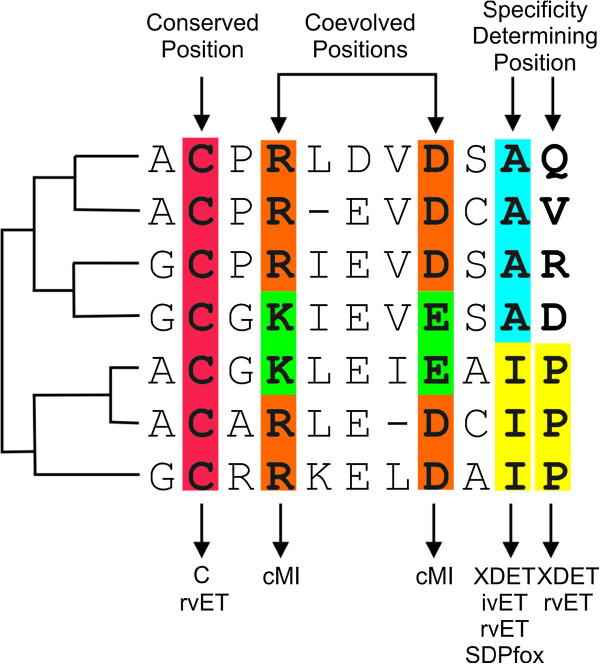
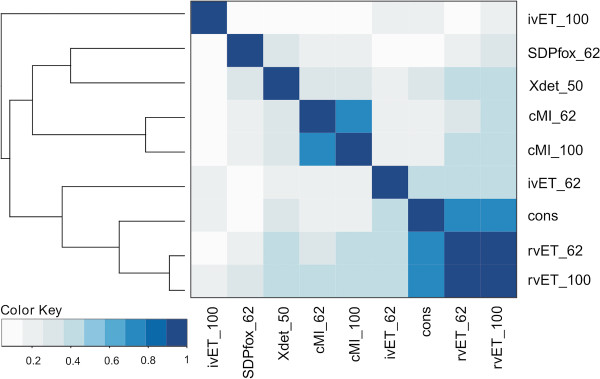
Results: Our results demonstrate that the different methods included in the benchmark in general can be divided into three groups with a limited mutual overlap. One group containing real-value Evolutionary Trace (rvET) methods and conservation, another containing mutual information (MI) methods, and the last containing methods designed explicitly for the identification of specificity determining positions (SDPs): integer-value Evolutionary Trace (ivET), SDPfox, and XDET. In terms of prediction of CR, we find using a proximity score integrating structural information (as the sum of the scores of residues located within a given distance of the residue in question) that only the methods from the first two groups displayed a reliable performance. Next, we investigated to what degree proximity scores for conservation, rvET and cumulative MI (cMI) provide complementary information capable of improving the performance for CR identification. We found that integrating conservation with proximity scores for rvET and cMI achieved the highest performance. The proximity conservation score contained no complementary information when integrated with proximity rvET. Moreover, the signal from rvET provided only a limited gain in predictive performance when integrated with mutual information and conservation proximity scores. Combined, these observations demonstrate that the rvET and cMI scores add complementary information to the prediction system.
Conclusions: This work contributes to the understanding of the different signals of evolution and also shows that it is possible to improve the detection of catalytic residues by integrating structural and higher order sequence evolutionary information with sequence conservation.
Figures
Similar articles
-
Networks of high mutual information define the structural proximity of catalytic sites: implications for catalytic residue identification.PLoS Comput Biol. 2010 Nov 4;6(11):e1000978. doi: 10.1371/journal.pcbi.1000978. PLoS Comput Biol. 2010. PMID: 21079665 Free PMC article.
-
MISTIC: Mutual information server to infer coevolution.Nucleic Acids Res. 2013 Jul;41(Web Server issue):W8-14. doi: 10.1093/nar/gkt427. Epub 2013 May 28. Nucleic Acids Res. 2013. PMID: 23716641 Free PMC article.
-
Evolutionary information hidden in a single protein structure.Proteins. 2012 Jun;80(6):1647-57. doi: 10.1002/prot.24058. Epub 2012 Mar 27. Proteins. 2012. PMID: 22454236
-
Scoring residue conservation.Proteins. 2002 Aug 1;48(2):227-41. doi: 10.1002/prot.10146. Proteins. 2002. PMID: 12112692 Review.
-
A global analysis of function and conservation of catalytic residues in enzymes.J Biol Chem. 2020 Jan 10;295(2):314-324. doi: 10.1074/jbc.REV119.006289. Epub 2019 Dec 3. J Biol Chem. 2020. PMID: 31796628 Free PMC article. Review.
Cited by
-
Prediction of Protein Sites and Physicochemical Properties Related to Functional Specificity.Bioengineering (Basel). 2021 Dec 3;8(12):201. doi: 10.3390/bioengineering8120201. Bioengineering (Basel). 2021. PMID: 34940354 Free PMC article.
-
Exploring Molecular Mechanisms of Paradoxical Activation in the BRAF Kinase Dimers: Atomistic Simulations of Conformational Dynamics and Modeling of Allosteric Communication Networks and Signaling Pathways.PLoS One. 2016 Nov 18;11(11):e0166583. doi: 10.1371/journal.pone.0166583. eCollection 2016. PLoS One. 2016. PMID: 27861609 Free PMC article.
-
Learning protein constitutive motifs from sequence data.Elife. 2019 Mar 12;8:e39397. doi: 10.7554/eLife.39397. Elife. 2019. PMID: 30857591 Free PMC article.
-
H2rs: deducing evolutionary and functionally important residue positions by means of an entropy and similarity based analysis of multiple sequence alignments.BMC Bioinformatics. 2014 Apr 27;15:118. doi: 10.1186/1471-2105-15-118. BMC Bioinformatics. 2014. PMID: 24766829 Free PMC article.
-
Ensemble-based modeling and rigidity decomposition of allosteric interaction networks and communication pathways in cyclin-dependent kinases: Differentiating kinase clients of the Hsp90-Cdc37 chaperone.PLoS One. 2017 Nov 2;12(11):e0186089. doi: 10.1371/journal.pone.0186089. eCollection 2017. PLoS One. 2017. PMID: 29095844 Free PMC article.
References
-
- Oliveira L W, Vriend G, Ljzerman AP. Identification of class-determining residues in G protein-coupled receptors by sequence analysis. Receptors Channels. 1997;5(3-4):159–174. - PubMed
Publication types
MeSH terms
Substances
Grants and funding
LinkOut - more resources
Full Text Sources
