

Computed tomographic pattern of physiological intracranial calcifications in a city in central Africa
- PMID: 22980109
- PMCID: PMC4777028
- DOI: 10.5539/gjhs.v4n1p184
Computed tomographic pattern of physiological intracranial calcifications in a city in central Africa
Abstract
Objective: Intracranial calcifications underlie certain brain diseases which may be de novo or systemic. But calcifications un-connected to pathologies are classified physiological.
Aim: To evaluate physiological intracranial calcifications in Douala with establishment of earliest age range of detection.
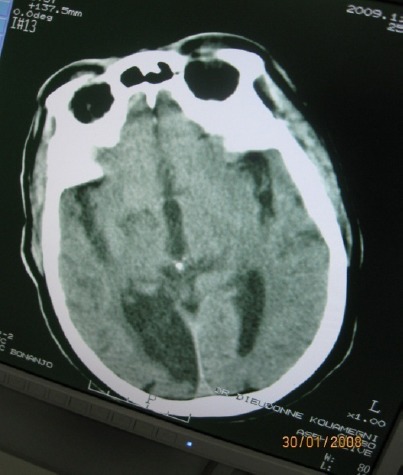
Materials and methods: Prospective study of brain computed tomograms was done from April to October 2009 using Schumadzu CT Scan machine. Axial, reconstructed and bone window images as well Hounsfield unit measurements were used for final evaluations. RESULTS were analysed with SSPS 3.
Results: 132 patients with 75 males and 57 females were studied and 163 separate calcifications were identified due to co-existent calcifications. The highest calcification was in choroid plexi, constituting 56.82% of the studied population. This was followed by pineal gland. Both were commonly co-existent with advancing age. These calcifications were first seen at 10-19 years. No type of physiological intracranial calcification was seen below age 10. The least calcification of 0.76% of population was in dentate nucleus.
Conclusion: No intra-cranial physiological calcifications started earlier than 9 years in Douala, a city in Cameroon, Central Africa.
Figures


Similar articles
-
Intracranial physiological calcifications in adults on computed tomography in Tabriz, Iran.Folia Morphol (Warsz). 2007 May;66(2):115-9. Folia Morphol (Warsz). 2007. PMID: 17594669
-
Intracranial physiological calcifications evaluated with cone beam CT.Dentomaxillofac Radiol. 2012 Dec;41(8):675-8. doi: 10.1259/dmfr/33077422. Epub 2012 Jul 27. Dentomaxillofac Radiol. 2012. PMID: 22842632 Free PMC article.
-
Physiological Intracranial Calcifications in Children: A computed tomography-based study.Sultan Qaboos Univ Med J. 2023 May;23(2):227-232. doi: 10.18295/squmj.9.2022.058. Epub 2023 May 31. Sultan Qaboos Univ Med J. 2023. PMID: 37377832 Free PMC article.
-
Intracranial calcifications on CT: an updated review.J Radiol Case Rep. 2019 Aug 31;13(8):1-18. doi: 10.3941/jrcr.v13i8.3633. eCollection 2019 Aug. J Radiol Case Rep. 2019. PMID: 31558966 Free PMC article. Review.
-
Intracranial calcifications in childhood: Part 1.Pediatr Radiol. 2020 Sep;50(10):1424-1447. doi: 10.1007/s00247-020-04721-1. Epub 2020 Jul 30. Pediatr Radiol. 2020. PMID: 32734340 Review.
Cited by
-
Prevalence of pineal gland calcification: systematic review and meta-analysis.Syst Rev. 2023 Mar 6;12(1):32. doi: 10.1186/s13643-023-02205-5. Syst Rev. 2023. PMID: 36879256 Free PMC article.
-
Prevalence of brain calcifications in a Brazilian cohort: A retrospective study in radiology services.Dement Neuropsychol. 2013 Apr-Jun;7(2):210-215. doi: 10.1590/S1980-57642013DN70200012. Dement Neuropsychol. 2013. PMID: 29213842 Free PMC article.
-
Assessment of Pineal Gland Volume and Calcification in Healthy Subjects: Is it Related to Aging?J Belg Soc Radiol. 2016 Feb 1;100(1):13. doi: 10.5334/jbr-btr.892. J Belg Soc Radiol. 2016. PMID: 30038974 Free PMC article.
References
-
- Admassie D, Mekonne A. Incidence of normal pineal and choroid plexus calcifications on brain CT (Computerized tomography) at Tikur Anbessa Teaching Hospital, Addis Ababa, Ethiopia. Ethiop.Med J. 2009;47(1):55–60. - PubMed
-
- Chapman S, Nakiel R. Aids to Radiological Differentials Diagnosis. 4th ed. Edinburg: Saunders; 2003. p. 428.
-
- Daghighi M. H, Rezaei V, Zarritan S, et al. Intracranial physiological calcifications in adults on computed tomography inTabriz, Iran. Folia Morph (Warsz) 2007;66(2):115–9. - PubMed
-
- Dahnert W. Radiology Review M anuel. 6th ed. Phildelphia: Wolters Klumer/Lippincort; 2003. p. 237.
MeSH terms
LinkOut - more resources
Full Text Sources
Medical
Miscellaneous