. 2012 Sep 13;12(3):360-72.
doi: 10.1016/j.chom.2012.07.011.

Tetherin/BST-2 is essential for the formation of the intracellular virus-containing compartment in HIV-infected macrophages

Affiliations

Tetherin/BST-2 is essential for the formation of the intracellular virus-containing compartment in HIV-infected macrophages

Hin Chu et al. Cell Host Microbe. .

Abstract

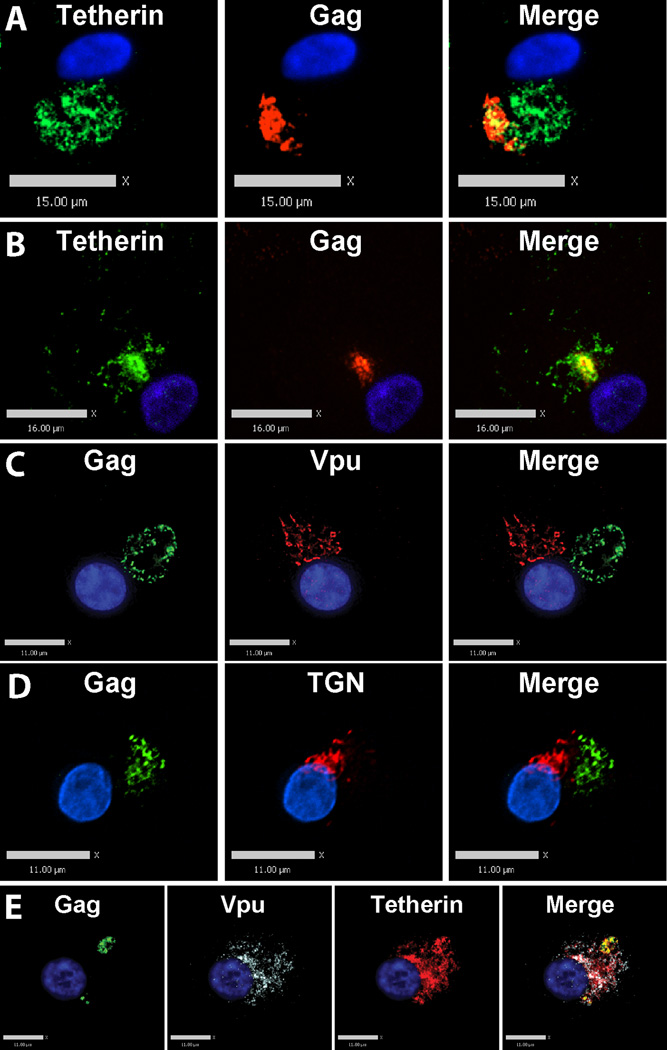
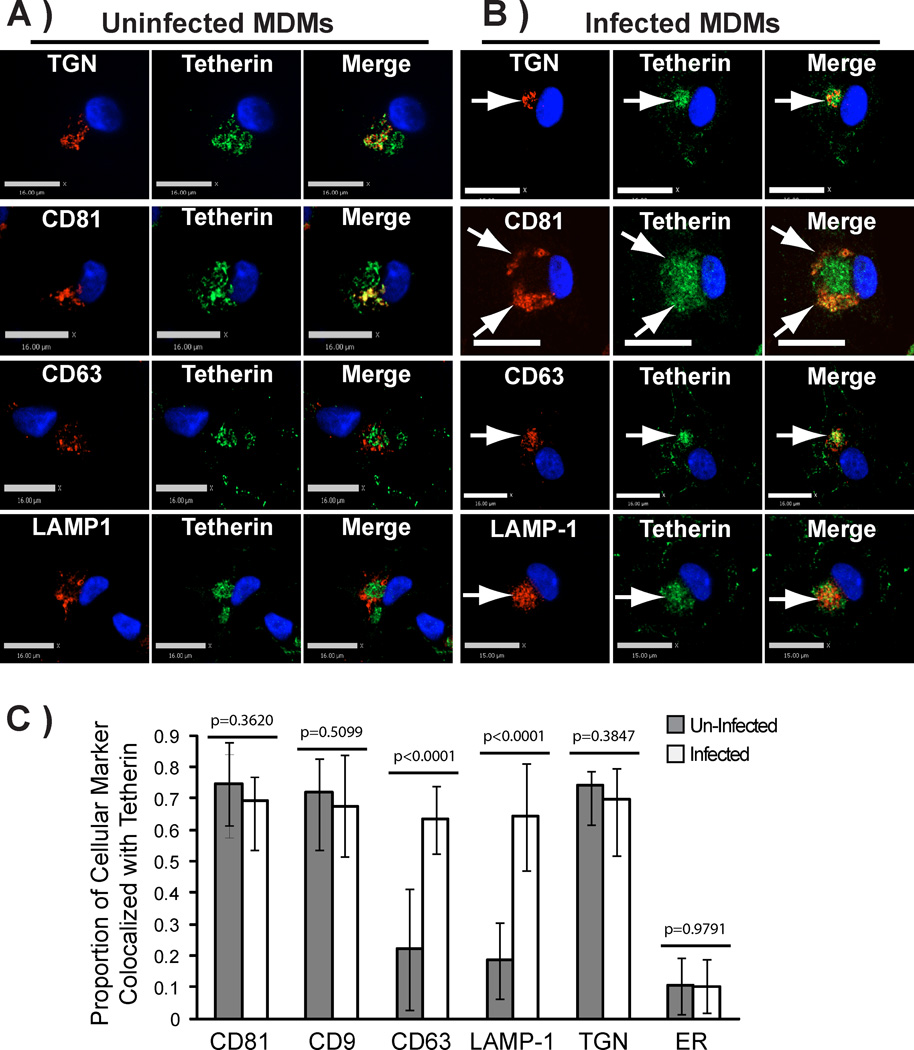
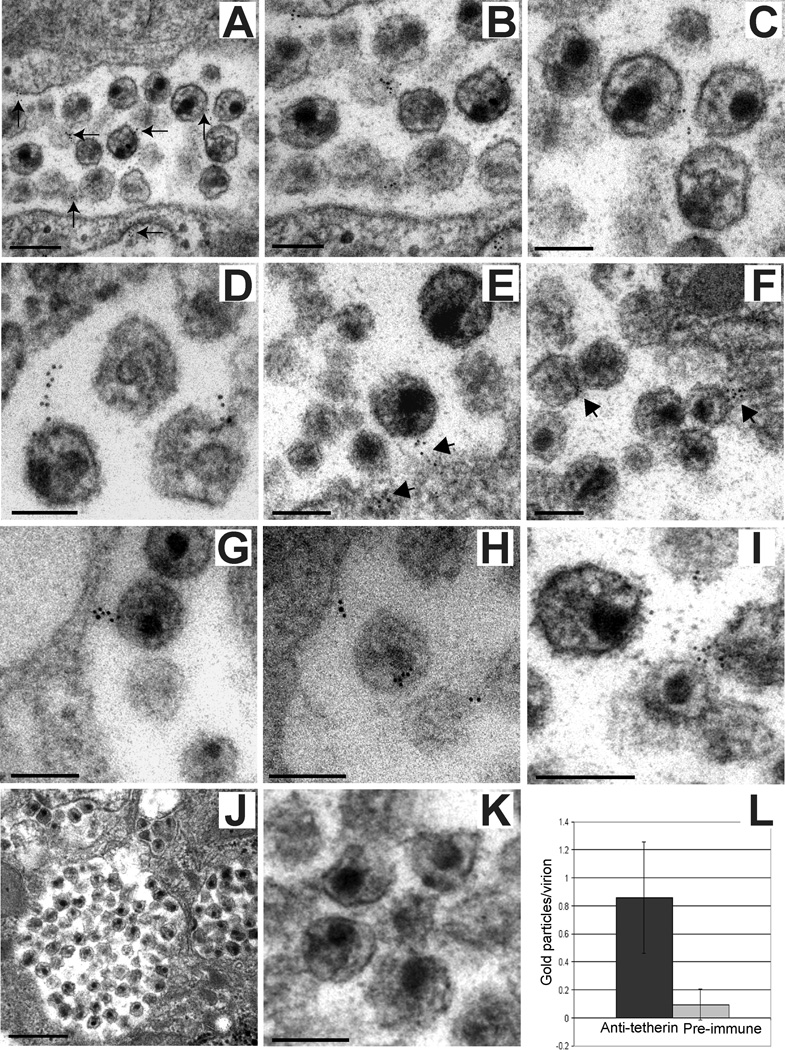
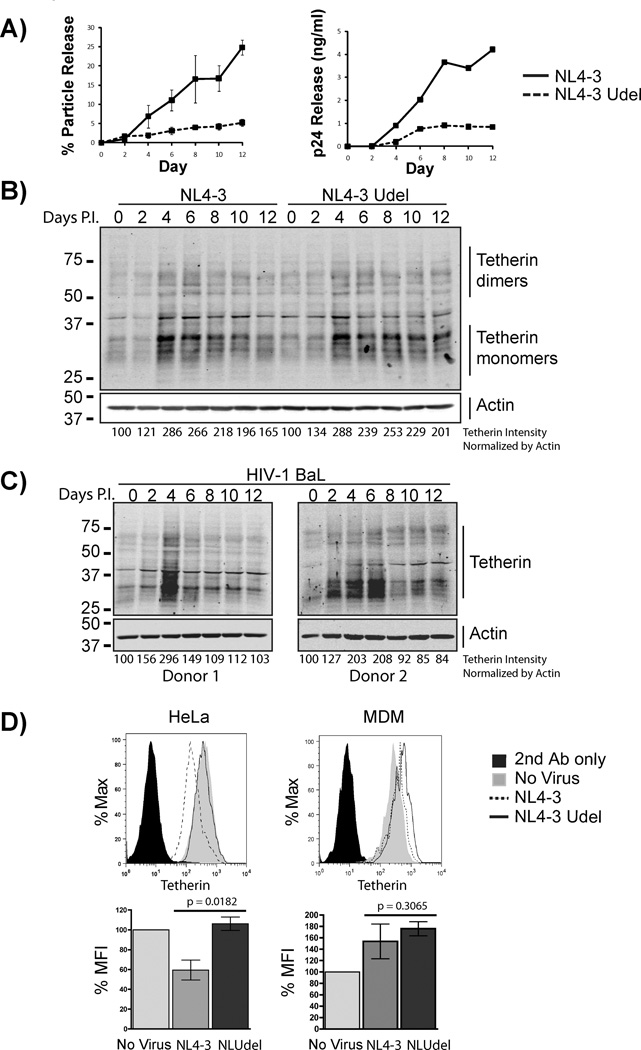
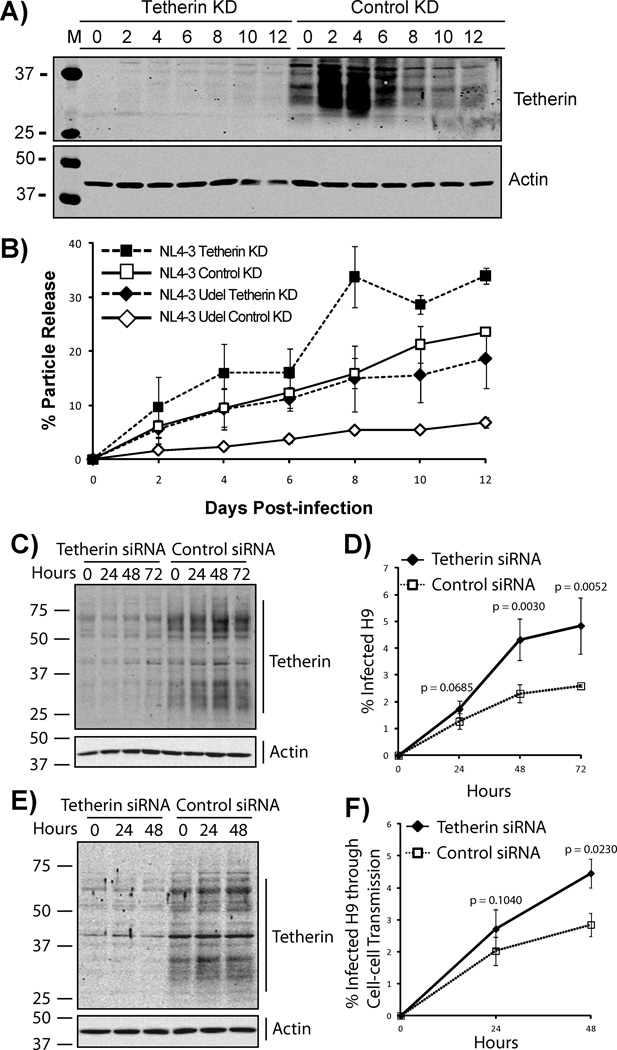
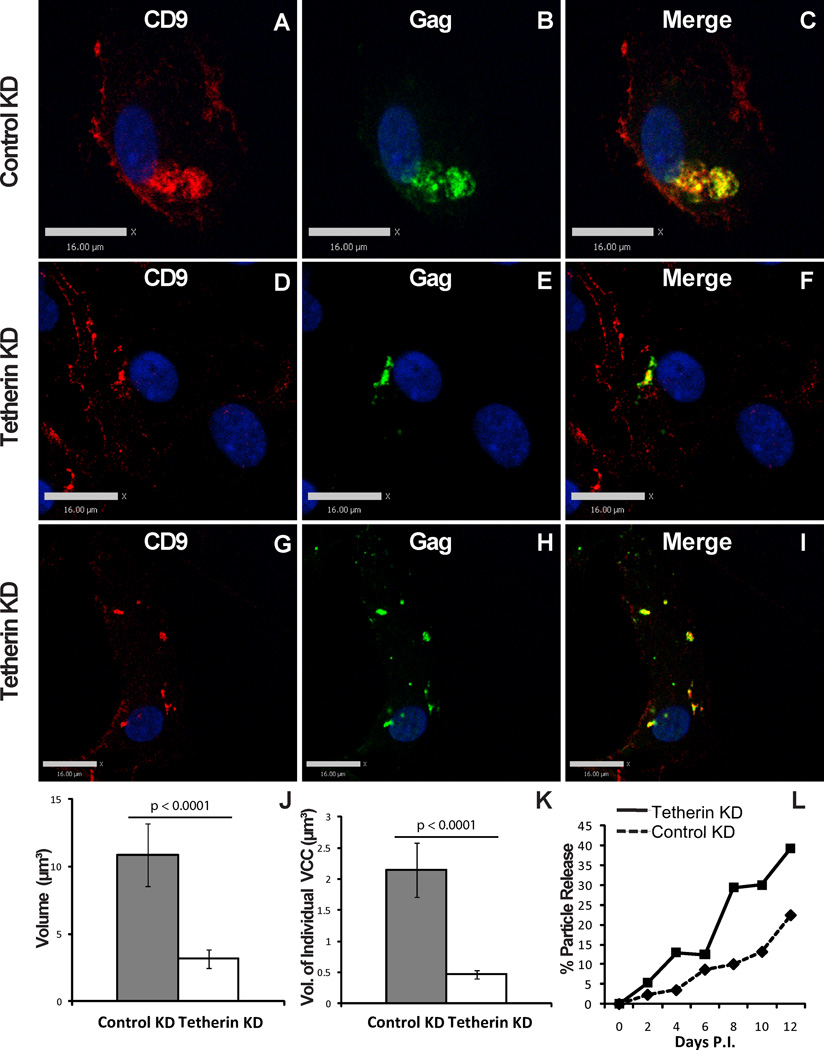
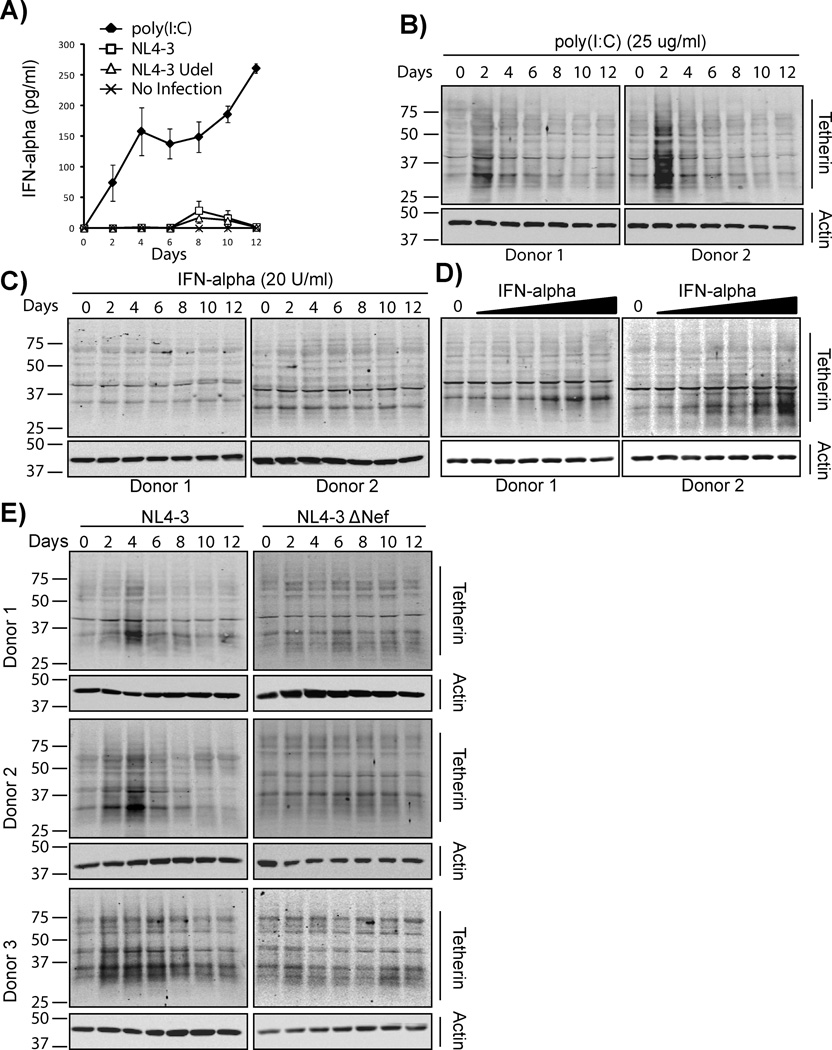
HIV-1 assembly and release occur at the plasma membrane in T lymphocytes, while intracellular sites of virus assembly or accumulation are apparent in macrophages. The host protein tetherin (BST-2) inhibits HIV release from the plasma membrane by retaining viral particles at the cell surface, but the role of tetherin at intracellular HIV assembly sites is unclear. We determined that tetherin is significantly upregulated upon macrophage infection and localizes to an intracellular virus-containing compartment (VCC). Tetherin localized at the virus-VCC membrane interface, suggesting that tetherin physically tethers virions in VCCs. Tetherin knockdown diminished and redistributed VCCs within macrophages and promoted HIV release and cell-cell transmission. The HIV Vpu protein, which downregulates tetherin from the plasma membrane, did not fully overcome tetherin-mediated restriction of particle release in macrophages. Thus, tetherin is essential for VCC formation and may account for morphologic differences in the apparent HIV assembly sites in macrophages versus T cells.


Figures

Figure 1
Figure 1. Tetherin is highly concentrated in virus-containing compartments within HIV-1-infected MDMs
(A) MDMs were infected with VSV-G-pseudotyped HIV-1 R8-BaL. 8 days post infection, cells were fixed and immunolabeled for HIV-1 Gag (red, anti-CA183) and tetherin (green, anti-tetherin). Bars represent 15 µm. (B) MDMs were infected with HIV-1 BaL biological stock. 8 days post infection, cells were fixed and immunolabeled for HIV-1 Gag (red, anti-CA183) and tetherin (green, anti-tetherin). Bars represent 16 µm. (C–E) MDMs were infected with VSV-G-pseudotyped HIV-1 R8-BaL for 8 days followed by fixation, permeabilization, and immunostaining for Vpu (red, anti-Vpu) and Gag (green, anti-CA183) in (C), for TGN (red, anti-TGN) and Gag (green, anti-CA183) in (D), and for Vpu (cyan, anti-Vpu), Gag (green, anti-CA183), and tetherin (red, anti-tetherin) in (E). Bars represent 11 µm. See also Figure S1.
Figure 2
Figure 2. Subcellular distribution of tetherin in uninfected MDMs
(A) Uninfected MDMs were fixed and immunolabeled for cellular markers (red, anti-TGN46, anti-CD81, anti-CD63, and anti-LAMP-1) and tetherin (green, anti-tetherin). Note lack of colocalization with CD63 and LAMP-1. Bars represent 16 µm. Images selected are representative of the major findings from more than 100 cells examined in five independent experiments. (B) MDMs were infected with VSV-G-pseudotyped HIV-1 NL4-3. 8 days post infection, cells were fixed and immunolabeled for cellular markers (red, anti-TGN46, anti-CD81, anti-CD63, and anti-LAMP-1) and tetherin (green, antitetherin). Bars represent 15 µm for LAMP-1 panel and 16 µm for the remaining panels. (C) Quantitation of colocalization between cellular marker and tetherin in uninfected (filled bars) or infected (white bars) MDMs. The partial correlation coefficient and standard deviation shown represents the degree of colocalization derived from images of at least 10 representative cells. Results were shown as mean ±SD. Statistical comparison between the groups were performed by unpaired t-test using GraphPad Prism 5. See also Figure S2.
Figure 3
Figure 3. Immunoelectron microscopic localization of tetherin within the virus-containing compartment in macrophages
MDMs were infected with VSV-G-pseudotyped HIV-1 NL4-3. Cells were harvested at day 8, fixed, embedded, and sectioned. Sections were etched with H2O2 and labeled with 6 nm gold beads using anti-tetherin antisera using methods previously established (Hammonds et al., 2010). (A) Multiple nanogold beads between particles at low power within a VCC, bar = 200 nm. Arrows added to point out beads. (B) Higher magnification view of left half of A, bar = 100nm. (C) Higher magnification view of upper right portion of A, bar = 100 nm. (D) Extended tether and beads between particles, bar = 100nm. (E) Tetherin at base of particles, between limiting membrane and particles within intracellular compartment in macrophages. Bar = 100nm. (F) Tetherin immunolabeling at base of particle and between particles within intracellular compartment in macrophages. Bar = 100nm. (G) Tetherin linking particle to the limiting membrane of a VCC, bar = 100nm. (H, I) Additional views of tetherin labeling within VCCs, on surface of virions and between virions. (J) VCC, control section employing pre-immune serum and immunogold labeling otherwise identical to that in A-I. Bar = 500nm. (K) Detail of same VCC as in (J) with control (preimmune) labeling, bar = 100nm. (L) Gold particles found within VCCs of HIV-infected macrophages, mean ± SD, using specific anti-tetherin sera (black) or preimmune sera (gray). Twenty consecutive VCCs with virions were assessed for each label, and normalized by total number of visualized particles. See Figure S3 for assessment of macrophage purity by flow cytometry.
Figure 4
Figure 4. Vpu and tetherin in infected MDMs
(A) Particle release from MDMs was assessed over time using a p24 antigen ELISA. The efficiency of release was plotted as percentage of extracellular p24/total p24 from 3 experiments. The majority of p24 was retained in macrophages infected with either NL4-3 or NLUdel, and total amounts of p24 (cell + sup) were similar. Right-sided graph represents one of the experiments, presented as released p24 antigen. Error bars represent SD. (B) Western blot of tetherin and actin over time following infection of MDMs. (C) Western blot of tetherin and actin over time from MDMs infected with HIV-1 BaL. MDMs were infected with HIV-1 BaL and cell lysates were harvested at the indicated time points. Western blots were performed as mentioned above. Results from 2 donors were shown as representatives of 5 independent experiments. (D) Cell surface levels of tetherin following infection with NL4-3 (dashed line) or NLUdel (solid line). Cells were stained with anti-p24 antibody to allow gating on the infected population. Results of individual experiments in HeLa (left) and MDMs (right) are shown. Below are %MFI with error bars representing SD at 48 hours postinfection (HeLa) or 4 days post-infection (MDMs), with results from three independent experiments plotted. Statistical comparison between the groups were performed by unpaired t-test using GraphPad Prism 5. See also Figure S4.
Figure 5
Figure 5. Effects of tetherin knockdown on particle release and cell-cell transmission from MDMs
(A) MDMs were transfected with tetherin siRNA or control siRNA for three times followed by NL4-3 infection. Infected cells were harvested at indicated time points post infection, lysed and analyzed by Western blotting using rabbit anti-tetherin or mouse anti-actin antiserum. (B) Particle release from tetherin siRNA or control siRNA treated and infected MDMs was assessed over time using a p24 antigen ELISA. The efficiency of release is plotted as percentage of extracellular p24/total p24 from 3 experiments, with standard deviations indicated. (C) Western blot of tetherin and actin from MDMs in cell-cell transmission assays. MDMs were treated with control or tetherin siRNA followed by NL4-3 infection. (D) H9 cells in contact with infected MDMs were harvested and fixed at the indicated time points, followed by labeling for CD3 and HIV-1 Gag. Flow cytometry was performed to analyze the percentage of infected H9 cells by gating on Gag and CD3-positive cells. Error bars represent SD. (E) Western blot of tetherin and actin of MDMs in cell-cell transmission assays using the Transwell system. (F) H9 cells were harvested from the insert chambers and the bottom chambers separately and labeled for CD3 and HIV-1 Gag. Flow cytometry was performed to analyze the percentage of H9 cells that were CD3 and Gag-positive. Cell-cell transmission events were derived by subtracting the cell-free transmission events from the total transmission events. Error bars represent SD. Statistical comparison between the groups were performed by unpaired t-test using GraphPad Prism 5.
Figure 6
Figure 6. Effect of tetherin knockdown on the virus-containing compartments in MDMs
(A–C) MDMs were transfected with control siRNA three times followed by infection with VSV-G-pseudotyped NL4-3. At day 4 post infection, cells were fixed and immunolabeled for CD9 (red, anti-CD9) and HIV-1 Gag (Green, anti-CA183). (D–I) MDMs were transfected with tetherin siRNA three times followed by infection with VSV-G-pseudotyped NL4-3. At day 4 post infection, cells were fixed and immunolabeled for CD9 (red, anti-CD9) and HIV-1 Gag (Green, anti- CA183). Bars represent 16 µm. (J) Quantitation of the volume of the VCCs in infected MDMs with tetherin knockdown or control knockdown. The volume of the VCCs within each cell for 30 cells was calculated using the Volocity 5.5.1 measurements module. (K) Quantitation of the volume of individual VCCs within infected MDMs with tetherin knockdown or control knockdown. Colocalized pixels between CD9 and Gag were determined as above and volumes calculated for individual VCCs, counting 150 VCCs for each arm of the experiment. Error bars in (J) and (K) represent SD. (L) Particle release from MDMs from the same donor in the experiment presented here was assessed over time using a p24 antigen ELISA.
Figure 7
Figure 7. Mechanism of tetherin upregulation in infected MDMs
(A) MDMs were infected with VSV-G-pseudotyped NL4-3 or VSV-G-pseudotyped NLUdel. MDMs from the same donors were stimulated with poly(I:C) by adding 25 ug/ml poly(I:C) in the cell cultures or were left untreated. IFN-α levels from the supernatants were measured by IFN-α ELISA. Error bars represent SD. (B) Western Blot of MDMs treated with 25 µg/ml high molecular weight poly(I:C). MDMs were harvested at indicated time points post poly(I:C) treatment, lysed and analyzed by Western blotting using rabbit anti-tetherin or mouse anti-actin antiserum. (C) Western Blot of MDMs treated with 20 U/ml human recombinant IFN-α. (D) MDMs were treated with 0, 10, 25, 50, 100, 500, or 1000 U/ml human recombinant IFN-α. 24 hours post the IFN-α treatment, MDMs were harvested and analyzed by Western blotting. (E) MDMs were infected with VSV-G-pseudotyped NL4-3 or VSV-G-pseudotyped NL4-3 delNef. Cell lysates were harvested at the indicated time points (days) and analyzed by Western blot for tetherin and actin expression.

Similar articles

Cited by

References

    1. Balliet JW, Kolson DL, Eiger G, Kim FM, McGann KA, Srinivasan A, Collman R. Distinct effects in primary macrophages and lymphocytes of the human immunodeficiency virus type 1 accessory genes vpr, vpu, and nef: mutational analysis of a primary HIV-1 isolate. Virology. 1994;200:623–631. - PubMed
    1. Bego MG, Mercier J, Cohen EA. Virus-Activated Interferon Regulatory Factor 7 Upregulates Expression of the Interferon-Regulated BST2 Gene Independently of Interferon Signaling. Journal of virology. 2012;86:3513–3527. - PMC - PubMed
    1. Bennett AE, Narayan K, Shi D, Hartnell LM, Gousset K, He H, Lowekamp BC, Yoo TS, Bliss D, Freed EO, et al. Ion-abrasion scanning electron microscopy reveals surface-connected tubular conduits in HIV-infected macrophages. PLoS Pathog. 2009;5:e1000591. - PMC - PubMed
    1. Casartelli N, Sourisseau M, Feldmann J, Guivel-Benhassine F, Mallet A, Marcelin AG, Guatelli J, Schwartz O. Tetherin restricts productive HIV-1 cell-to-cell transmission. PLoS Pathog. 2010;6:e1000955. - PMC - PubMed
    1. Chu H, Wang JJ, Spearman P. Human immunodeficiency virus type-1 gag and host vesicular trafficking pathways. Curr Top Microbiol Immunol. 2009;339:67–84. - PubMed

Publication types

LinkOut - more resources