. 2012 Sep 14;150(6):1135-46.
doi: 10.1016/j.cell.2012.07.033.

Loss of 5-hydroxymethylcytosine is an epigenetic hallmark of melanoma

Affiliations

Loss of 5-hydroxymethylcytosine is an epigenetic hallmark of melanoma

Christine Guo Lian et al. Cell. .

Abstract

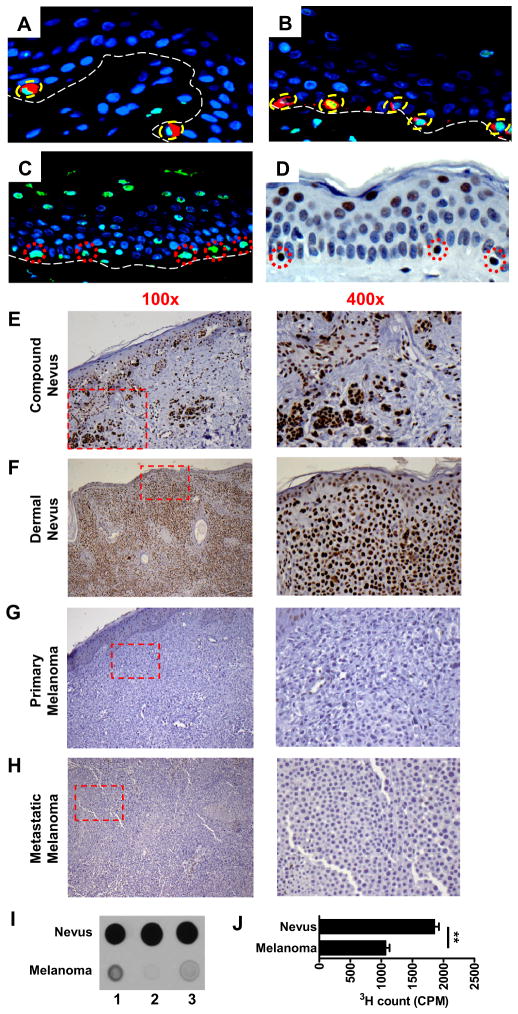
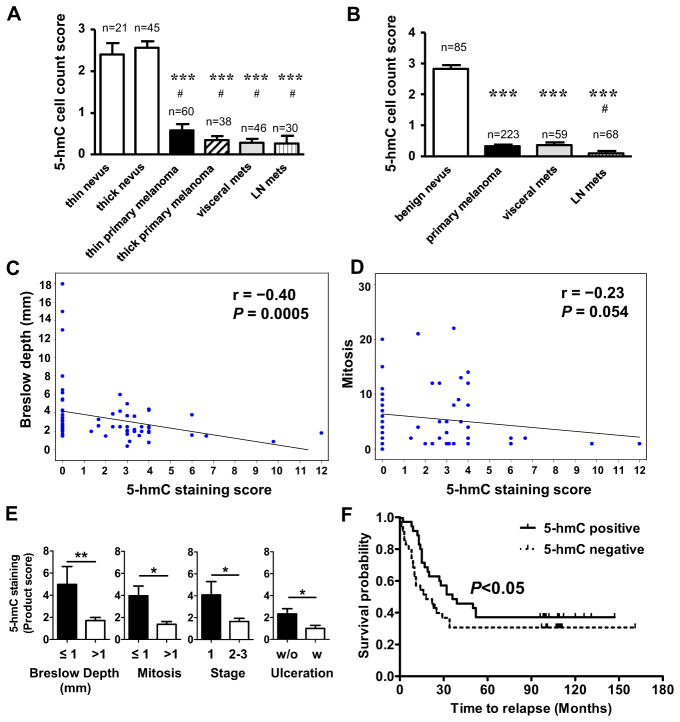
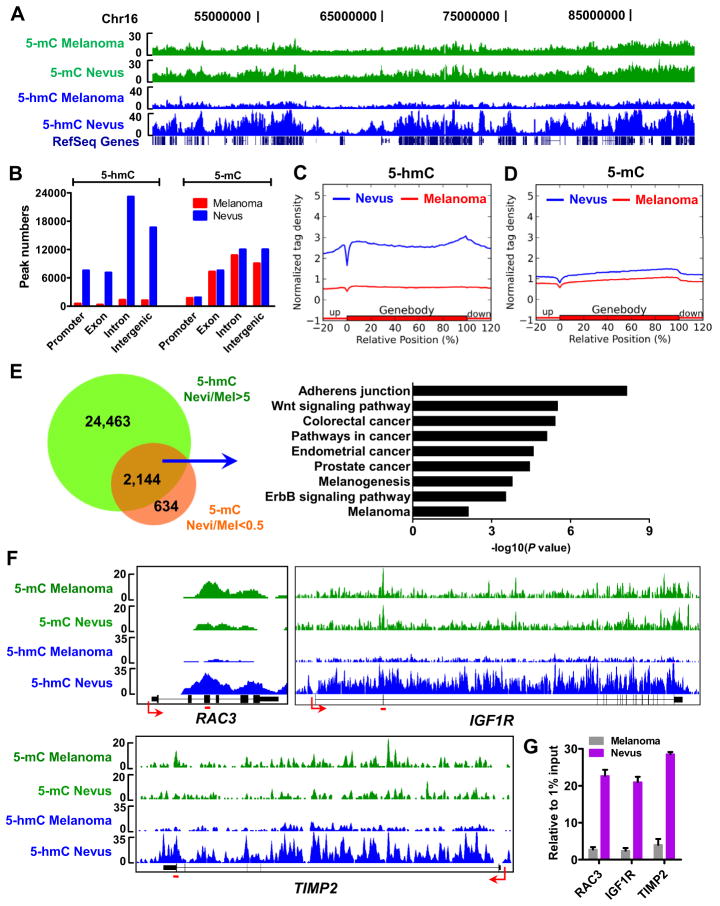
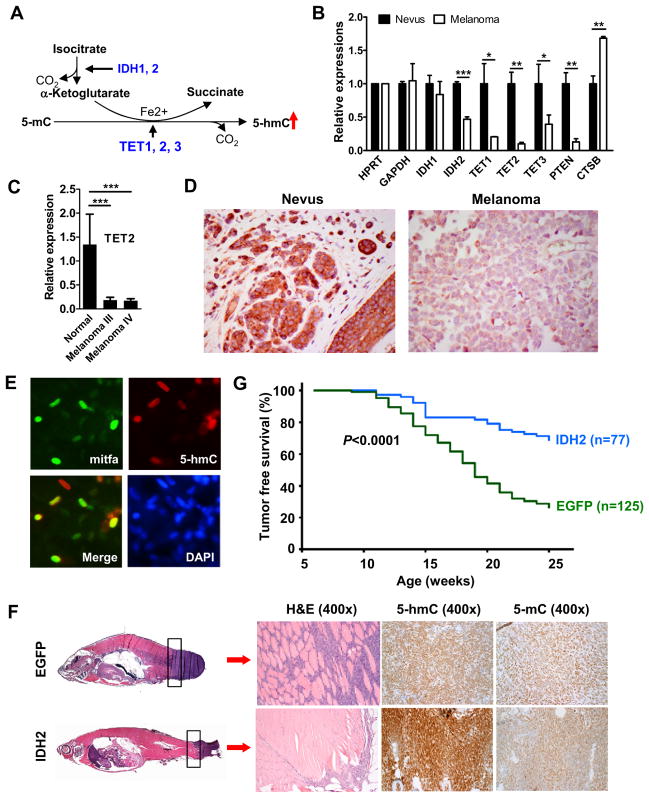
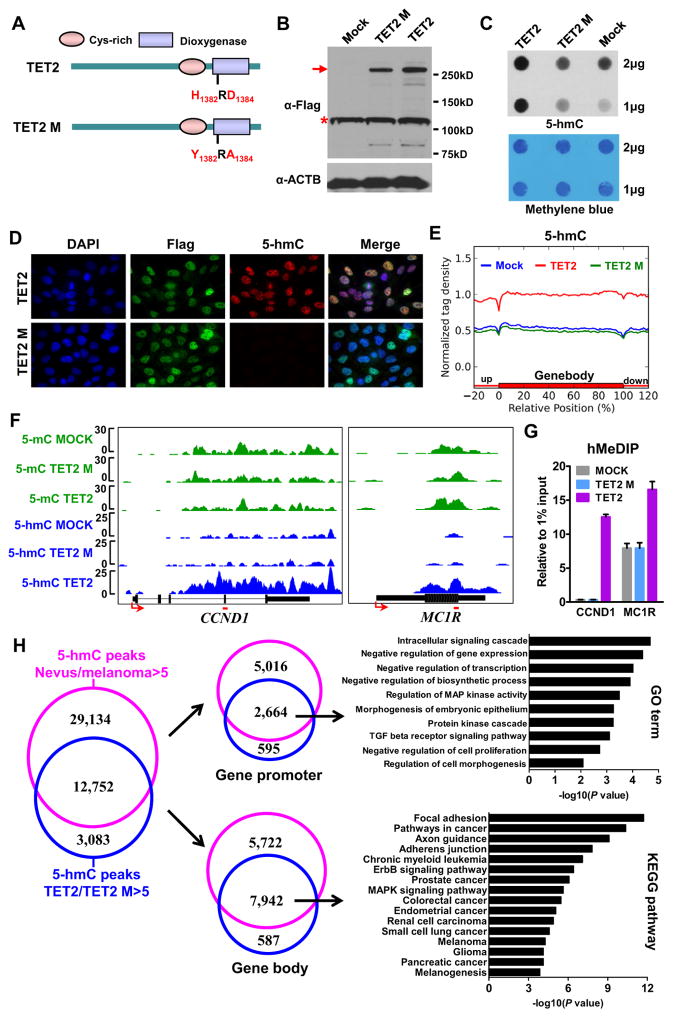
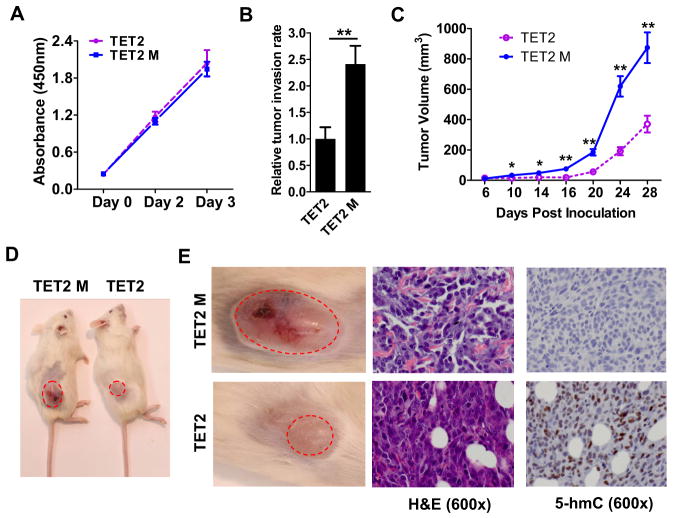
DNA methylation at the 5 position of cytosine (5-mC) is a key epigenetic mark that is critical for various biological and pathological processes. 5-mC can be converted to 5-hydroxymethylcytosine (5-hmC) by the ten-eleven translocation (TET) family of DNA hydroxylases. Here, we report that "loss of 5-hmC" is an epigenetic hallmark of melanoma, with diagnostic and prognostic implications. Genome-wide mapping of 5-hmC reveals loss of the 5-hmC landscape in the melanoma epigenome. We show that downregulation of isocitrate dehydrogenase 2 (IDH2) and TET family enzymes is likely one of the mechanisms underlying 5-hmC loss in melanoma. Rebuilding the 5-hmC landscape in melanoma cells by reintroducing active TET2 or IDH2 suppresses melanoma growth and increases tumor-free survival in animal models. Thus, our study reveals a critical function of 5-hmC in melanoma development and directly links the IDH and TET activity-dependent epigenetic pathway to 5-hmC-mediated suppression of melanoma progression, suggesting a new strategy for epigenetic cancer therapy.


Figures

Figure 1
Figure 1. 5-hmC level is high in mature melanocytes and lost in melanomas
(A–B) IF co-staining of 5-hmC and MART1 in normal human skin without HCl treatment. Green: 5-hmC; red: MART1; blue: DAPI counterstain of DNA. Among basal layer cells (dotted white line), 5-hmC-positive cells exclusively proved to be MART-1-positive melanocytes (dotted circles). (C–D) Detecting 5-hmC in normal human skin by IF (C) and IHC staining (D) with HCl treatment. Both methods showed strong nuclear staining in isolated, solitary cells within the basal layer (dotted circles), in nuclei within the uppermost epidermal layers and occasional dermal cells. (E–H) Representative histology of 5-hmC IHC staining in the individual cases of benign and malignant melanocytic lesions. Low power images (100×) on the left column with the dotted red area magnified at high power (400×) on the right column. All slides were counterstained with hematoxylin (light blue). (I) Immunoblotting assay shows significantly higher 5-hmC levels in benign nevi than in melanomas. Three representative immunoblot images are shown here from the 10 cases of each group. (J) 5-hmC glucosylation assay confirms that the 5-hmC level in the genomic DNA of nevi is significantly higher than that in melanomas. **P<0.01 by Student’s t-test. Data are shown as mean ± SD (n=3). See also Figure S1 and Table S1.
Figure 2
Figure 2. Loss of 5-hmC correlated with melanoma progression
(A) Analysis of 5-hmC levels in the SPORE TMA represented by positive cell count score. Each column represents a category of melanocytic lesion (n=number of cases, each case has duplicated tissue cores). Data are shown as mean ± SEM. ***P<0.001 compared to benign thin nevi; #P<0.001 compared to benign thick nevi. (B) Combined cell count scores of 5-hmC staining of three tissue microarrays. Each column represents a category of melanocytic lesion (n=number of cases). Data are shown as mean ± SEM. ***P<0.001 compared to benign nevus, #P<0.05 compared to visceral metastases. (C–D) The Spearman correlation between Breslow depth and 5-hmC staining product score (C) or between mitosis and 5-hmC staining product score (D). (E) 5-hmC staining product scores are correlated with critical melanoma staging parameters. Data are shown as mean ± SEM. *P<0.05, **P<0.01 by Student’s t-test. (F) Kaplan-Meier survival curves of melanoma patients with positive 5-hmC staining (solid line) and negative 5-hmC staining (dashed line). P < 0.05 by Gehan-Breslow-Wilcoxon Test. See also Figure S2 and Tables S2–S6.
Figure 3
Figure 3. Genome-wide mapping of 5-mC and 5-hmC in benign nevi and melanomas
(A) The distribution of 5-mC (green) and 5-hmC (blue) densities in the region of chr16:46,651,039-89,749,255 by MeDIP-seq and hMeDIP-seq. Refseq genes are shown at the bottom. (B) 5-mC and 5-hmC peak numbers of nevus (red) and melanoma (blue) hMeDIP samples in different genomic regions. Promoters were defined as −2k to +2k relative to TSS. (C–D) Normalized 5-hmC (C) and 5-mC (D) tag density distribution across the gene body. Each gene body was normalized to 0–100%. Normalized Tag density is plotted from 20% of upstream of TSSs to 20% downstream of TTSs. (E) Peaks at which 5-hmC is significantly reduced (>5-fold) and 5-mC is significantly increased (>2-fold) in gene bodies in melanomas (Mel) compared to nevi (left panel), and the KEGG pathway analysis results for the associated genes (right panel). (F–G) MeDIP-seq and hMeDIP-seq results of RAC3, IGF1R and TIMP2 genes (F) and hMeDIP-qPCR verifications (G). The primer targeted regions in panel G are noted by red lines in panel F. Data are shown as mean ± SD (n=3) in panel G. See also Figure S3 and Table S7.
Figure 4
Figure 4. Increased 5-hmC level by IDH2 over-expression in a zebrafish melanoma model prolongs tumor free survival
(A) Schematic diagram of 5-hmC generation by the TET family of 5-mC DNA hydroxylases with cofactors α-ketoglutarate and Fe2+. (B) Relative expression of genes in nevus and melanoma by RT-qPCR. Each gene expression level was normalized to HPRT house-keeping gene. Data are shown as the mean of three individual patients ± SEM. *P<0.05, **P<0.01, *** P<0.001 by Student’s t-test comparing nevus to melanoma. (C) Relative TET2 expression in human melanoma cDNA arrays including normal skin (n=3), stage III (n=21) and stage IV melanomas (n=19) by RT-qPCR. Data are shown as mean ± SEM. *** P<0.001 compared the normal skin by Student’s t-test. (D) Representative IDH2 IHC staining images in nevi (n=4) and melanomas (n=8) at high power (400×). (E) IF staining of 5-hmC and mitfa in normal zebrafish melanocytes. Green: mitfa; red: 5-hmC; blue: DAPI counterstain of DNA. (F) Tumors were smaller and less invasive and had higher 5-hmC levels in miniCoopR IDH2 zebrafish than mini-CoopR EGFP control zebrafish. Histology of the melanomas from miniCoopR-EGFP control zebrafish and miniCoopR-IDH2 zebrafish are shown in the left panels. The H&E staining of tumor sections shows an infiltrative pattern of tumor in control miniCoopR-EGFP zebrafish at the body and tail junction, while the tumor shows much less infiltrative borders in IDH2 over-expressing zebrafish. (G) Significant prolongation of tumor-free survival in miniCoopR-IDH2 zebrafish (n=77) compared with miniCoopR-EGFP control zebrafish (n=125). See also Figure S4 and Table S8.
Figure 5
Figure 5. TET2 over-expression re-establishes the 5-hmC landscape in the epigenome of human melanoma cells
(A) Schematic diagram of TET2 wt and TET2 catalytically inactive mutant (TET2 M) proteins. (B) The expression of Flag-tagged TET2 and Flag-tagged TET2 M proteins by Western blot. Red arrow denotes the full length TET2 and TET2 M bands, and red star denotes non-specific bands. ACTB was used as a loading control. (C) Global 5-hmC levels in MOCK, A2058 TET2 and A2058 TET2 M stable cell lines by dot-blot assay. The Methylene blue staining was used as total genomic DNA loading control. (D) IF analysis of A2058 TET2 and A2058 TET2 M stable cell lines. The Flag antibody was used to detect Flag-tagged TET2 and Flag-tagged TET2 M. Blue: DAPI counterstain of DNA; green: Flag; red: 5-hmC. (E) Normalized 5-hmC tag density distribution across the gene body. Each gene body was normalized to 0–100%. Normalized tag density is plotted from 20% of upstream of TSSs to 20% downstream of TTSs. (F–G) MeDIP-seq and hMeDIP-seq results of CCND1 and MC1R genes (F) and hMeDIP-qPCR verifications (G). The primer targeted regions in panel G are noted by red lines in panel F. Data are shown as mean ± SD (n=3) in panel G. (H) Venn diagrams showing the overlap between 5-hmC peaks which are dramatically higher (>5-fold) in nevi than melanomas (pink) and 5-hmC peaks which are dramatically higher (>5-fold) in TET2 over-expression cells compared to TET2 M over-expression cells (blue) (left panel), and the associated genes according the peak location either at gene promoter (middle upper panel) or in gene body (middle lower panel). The GO term and KEGG pathway analyses results are shown in the right panels. See also Figures S3 and S5 and Table S7.
Figure 6
Figure 6. Over-expression of TET2 in human melanoma cells suppresses tumor growth in NSG xenograft mice
(A) The proliferation curves of A2058 TET2 and A2058 TET2 M stable cell lines. (B) A2058 TET2 melanoma cells show less in vitro invasion than A2058 TET2 M melanoma cells by Matrigel tumor invasion assay. Data are shown as mean ± SD (n=3). ** P<0.01 by Student’s t-test. (C) Tumor growth curves of A2058 TET2 and A2058 TET2 M cells xenografted to NSG mice. Data are shown as mean± SEM (n=10). *P<0.05, **P<0.01 by Student’s t-test. (D) Representative images of tumor-bearing NSG mice xenografted with A2058 TET2 M (left) or A2058 TET2 cells (right) at 4 weeks post inoculation. (E) H&E and 5-hmC IHC staining of TET2 M (upper) and TET2 (lower) xenografts. The regions shown in left panels are noted by red dash circles in panel D.

Comment in

References

    1. Ceol CJ, Houvras Y, Jane-Valbuena J, Bilodeau S, Orlando DA, Battisti V, Fritsch L, Lin WM, Hollmann TJ, Ferre F, et al. The histone methyltransferase SETDB1 is recurrently amplified in melanoma and accelerates its onset. Nature. 2011;471:513–517. - PMC - PubMed
    1. Chowdhury R, Yeoh KK, Tian YM, Hillringhaus L, Bagg EA, Rose NR, Leung IK, Li XS, Woon EC, Yang M, et al. The oncometabolite 2-hydroxyglutarate inhibits histone lysine demethylases. EMBO Rep. 2011;12:463–469. - PMC - PubMed
    1. Cimmino L, Abdel-Wahab O, Levine Ross L, Aifantis I. TET Family Proteins and Their Role in Stem Cell Differentiation and Transformation. Cell stem cell. 2011;9:193–204. - PMC - PubMed
    1. Conway K, Edmiston SN, Khondker ZS, Groben PA, Zhou X, Chu H, Kuan PF, Hao H, Carson C, Berwick M, et al. DNA-methylation profiling distinguishes malignant melanomas from benign nevi. Pigment cell & melanoma research. 2011;24:352–360. - PMC - PubMed
    1. Dang L, Jin S, Su SM. IDH mutations in glioma and acute myeloid leukemia. Trends Mol Med. 2010;16:387–397. - PubMed

Publication types

Associated data