. 2012 Sep 14;150(6):1147-57.
doi: 10.1016/j.cell.2012.08.004.

Microprocessor, Setx, Xrn2, and Rrp6 co-operate to induce premature termination of transcription by RNAPII

Affiliations

Microprocessor, Setx, Xrn2, and Rrp6 co-operate to induce premature termination of transcription by RNAPII

Alexandre Wagschal et al. Cell. .

Abstract

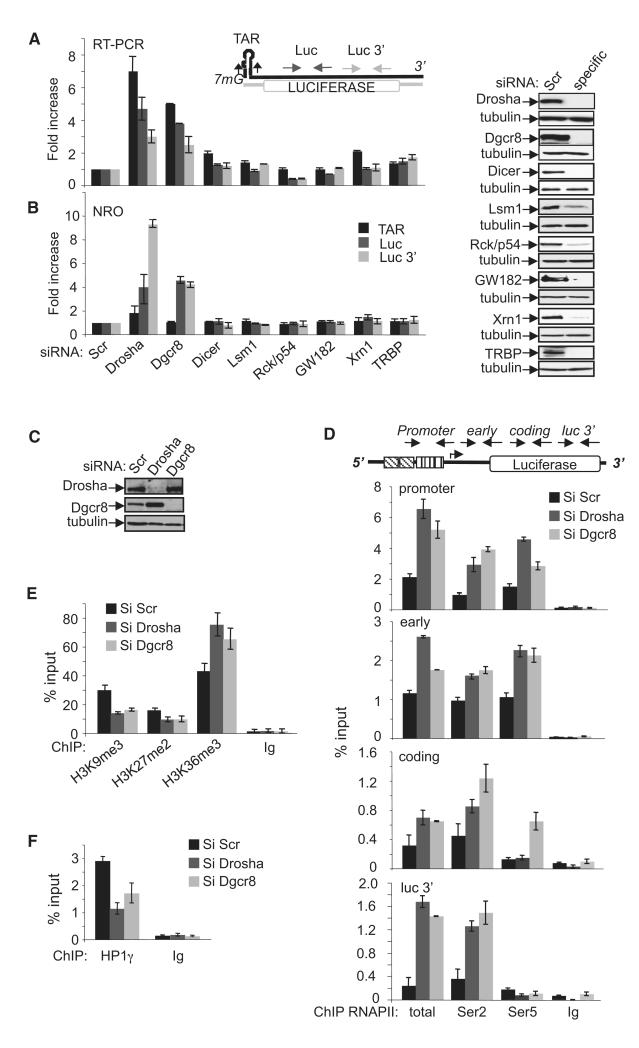
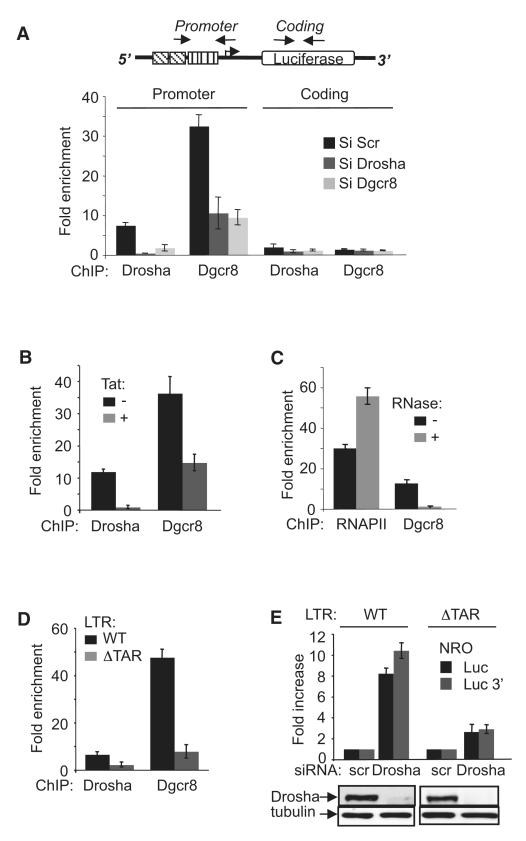
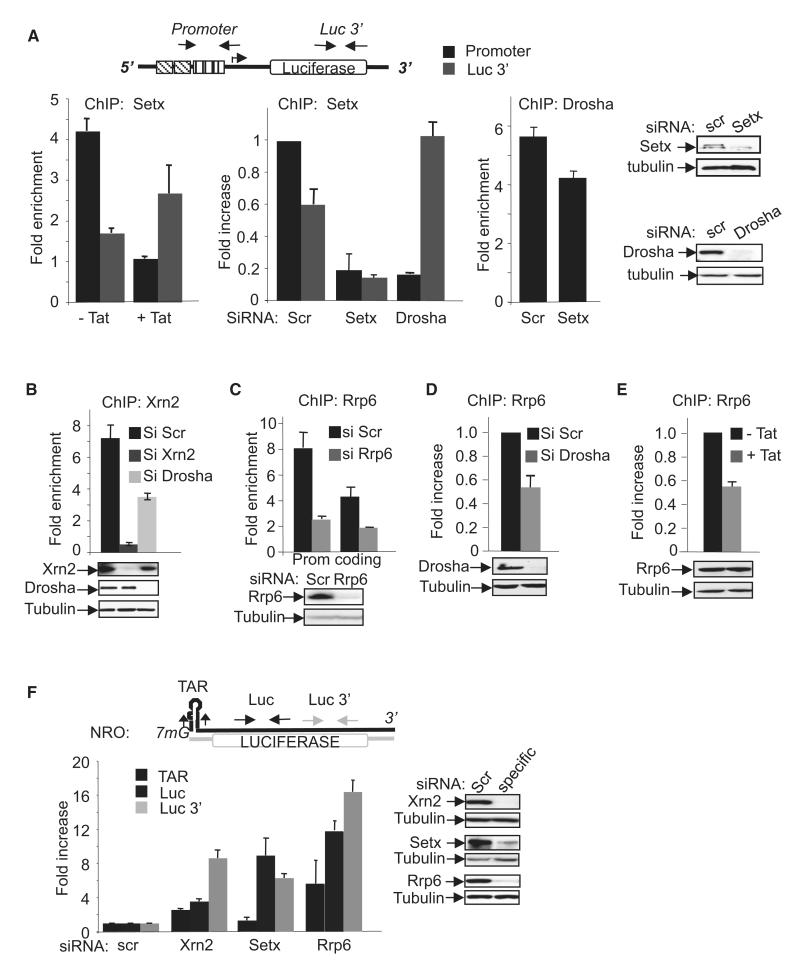
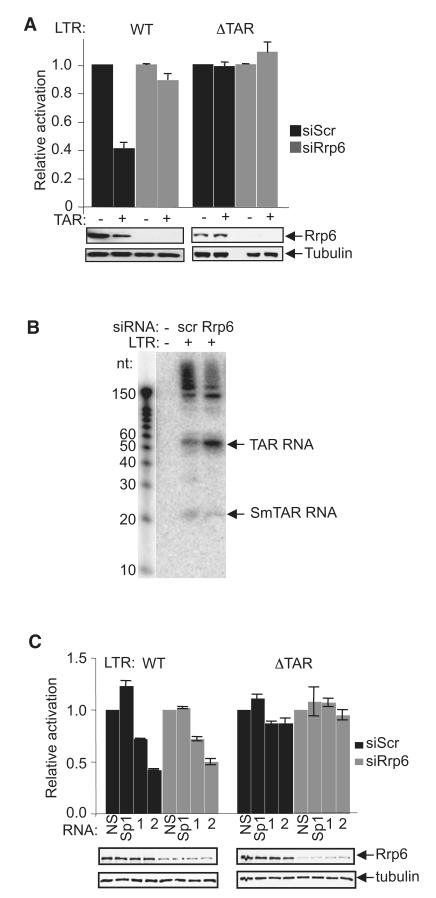
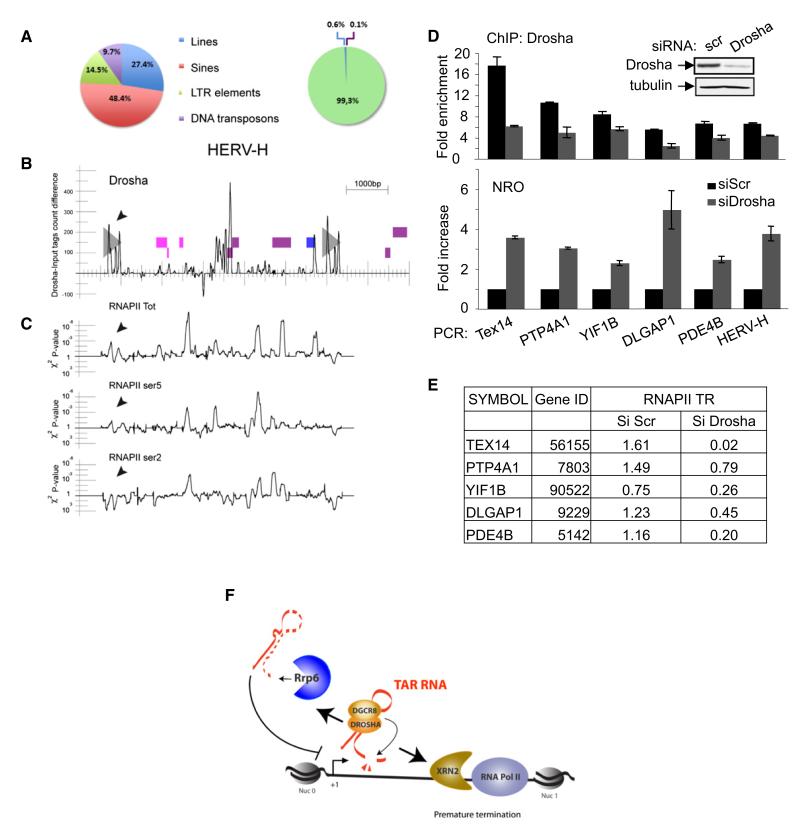
Transcription elongation is increasingly recognized as an important mechanism of gene regulation. Here, we show that microprocessor controls gene expression in an RNAi-independent manner. Microprocessor orchestrates the recruitment of termination factors Setx and Xrn2, and the 3'-5' exoribonuclease, Rrp6, to initiate RNAPII pausing and premature termination at the HIV-1 promoter through cleavage of the stem-loop RNA, TAR. Rrp6 further processes the cleavage product, which generates a small RNA that is required to mediate potent transcriptional repression and chromatin remodeling at the HIV-1 promoter. Using chromatin immunoprecipitation coupled to high-throughput sequencing (ChIP-seq), we identified cellular gene targets whose transcription is modulated by microprocessor. Our study reveals RNAPII pausing and premature termination mediated by the co-operative activity of ribonucleases, Drosha/Dgcr8, Xrn2, and Rrp6, as a regulatory mechanism of RNAPII-dependent transcription elongation.


Figures

Figure 1
Figure 1. Drosha and Dgcr8 Are Transcriptional Repressors of the Integrated HIV-1 Promoter
(A and B) RNA isolated from HeLa LTR-Luc cells transfected with the indicated siRNAs was analyzed by reverse-transcription q-PCR and NRO using the primers indicated on the schematic above the graphs. Values were normalized to that of GAPDH in the same samples. The result for Scrtreated cells was attributed a value of 1. The knockdown of specific factors was validated by immunoblot (right). (C) Validation of RNAi knockdowns by immunoblot using the indicated antibodies. (D) ChIP assay was performed using the indicated antibodies and chromatin prepared from HeLa LTR-Luc cells transfected with control (Si Scr), Drosha, or Dgcr8 siRNAs as indicated. Locations of primers used are indicated on the schematic above the graphs. The amount of immunoprecipitated material for each PCR was normalized to the input DNA. (E) Native ChIP was performed using the indicated antibodies and chromatin from cells transfected with the indicated siRNAs. The promoter region was amplified by q-PCR. The amount of immunoprecipitated material was normalized to the input DNA. (F) ChIP was performed using anti-HP1g or a control IgG and chromatin prepared from HeLa LTR-Luc cells transfected with the indicated siRNAs. The promoter region was amplified by q-PCR. The amount of immunoprecipitated material was normalized to the input DNA. All graphs show mean ± SE from three independent experiments. See also Figure S1.
Figure 2
Figure 2. HIV-1 TAR RNA Is Required for Drosha and Dgcr8-Mediated Transcriptional Repression of the HIV-1 Promoter
(A) ChIP assay was performed as in Figure 1 using the indicated antibodies and chromatin prepared from HeLa LTR-Luc cells transfected with the indicated siRNAs. Results are defined as enrichment over that of a mock precipitation with an unrelated IgG antiserum. Locations of primers used to amplify promoter-proximal and coding region sequences are indicated on the schematic above the graph. (B) ChIP was performed using the indicated antibodies and chromatin prepared from HeLa LTR-Luc cells treated with Tat or mock treated as indicated. The presence of HIV-1 promoter region in immunoprecipitated materials was determined by q-PCR. Results are presented as fold enrichment over that of a mock precipitation using an unrelated IgG antiserum. (C) ChIP was performed using the indicated antibodies and chromatin prepared from HeLa LTR-Luc cells that had been pretreated with RNase or mock treated as indicated. The presence of HIV-1 promoter-proximal region in immunoprecipitated materials was determined by q-PCR. Results are presented as fold enrichment over that of a mock precipitation using an unrelated IgG antiserum. (D) ChIP assay was performed using the indicated antibodies and chromatin prepared from HeLa LTR-Luc (WT) and HeLa LTRΔTAR-Luc (ΔTAR) cells. The presence of HIV-1 promoter-proximal region in immunoprecipitated materials was determined by q-PCR. Results are presented as fold enrichment over that of a mock precipitation using an unrelated IgG antiserum. (E) Nuclei isolated from HeLa LTR-Luc (WT) or HeLa LTRΔTAR-Luc (ΔTAR) cells transfected with the indicated siRNAs were analyzed by NRO using the primers indicated. Values were normalized to that of GAPDH in the same samples. The result for scr-treated cells was attributed a value of 1. The knockdown of Drosha was validated by immunoblot (bottom). All graphs show mean ± SE from three independent experiments. See also Figure S2.
Figure 3
Figure 3. Drosha-Dependent Recruitment of Setx, Xrn2, and Rrp6 to the HIV-1 Promoter-Proximal Region
(A) ChIP assay was performed using the indicated antibody and chromatin from Tat-treated or siRNA-treated HeLa LTR-Luc cells, as indicated. Locations of primers used to amplify the promoter-proximal and luc 3′ regions are indicated on the schematic above the graphs. Results are presented as fold enrichment over that of a mock precipitation using an unrelated IgG antiserum. Knockdown efficiency of the siRNA was assessed by immunoblotting using the indicated antibodies. (B–E) ChIP assay was performed using the indicated antibody and chromatin from siRNA-treated or Tat-treated HeLa LTR-Luc cells. Unless indicated otherwise, the promoter-proximal region was amplified by q-PCR. Results are presented as fold enrichment over that of a mock precipitation using an unrelated IgG antiserum or fold increase relative to the control sample (siScr), which was attributed a value of 1. Knockdown efficiencies of the siRNAs were assessed by immunoblotting using the indicated antibodies. (F) NRO performed using nuclei prepared from HeLa LTR-Luc cells transfected with the indicated siRNAs. Regions amplified by PCR are indicated above the graph. Values were normalized to the amount of GAPDH RNA in the same samples. The result for Scr-treated cells was attributed a value of 1. Knockdown efficiencies of the siRNAs were assessed by immunoblotting using the indicated antibodies. All graphs show mean ± SE from three independent experiments. See also Figure S3.
Figure 4
Figure 4. Small TAR-Derived RNAs Repress LTR Activity
(A) HeLa LTR-Luc (WT) or HeLa LTRΔTAR-Luc (ΔTAR) cells transfected with control (scr) or Rrp6 siRNA, with or without TAR RNA (1 μg), as indicated, were harvested for luciferase assay (top) and immunoblotting using the antibodies indicated (bottom). For each condition, values were normalized to the control sample that was mock transfected with TAR RNA, which was assigned a value of 1. (B) Northern blot analysis of TAR and TAR-derived RNAs obtained from HIV-1-infected cells transfected with the indicated siRNAs. RNA decade marker run in parallel is shown at left. (C) HeLa LTR-Luc (WT) or HeLa LTRΔTAR-Luc (ΔTAR) cells transfected with control (scr) or Rrp6 siRNA and the indicated RNA oligonucleotides were harvested for luciferase assay (top) and immunoblotting using the antibodies indicated (bottom). For each condition, values were normalized to the control sample, which was assigned a value of 1. All graphs represent mean ± SE obtained from at least three independent experiments. See also Figure S4.
Figure 5
Figure 5. ChIP-seq Analysis Reveals the Endogenous Loci that Are Targets for Drosha
(A) Pie charts summarizing the relative abundance of LINES, SINES, LTR elements, and DNA transposons in the human genome (left) and those bound by Drosha (right). The observed and expected numbers of tags are significantly different (chi-square test, p < 10−15). See also Table S1. (B) Chr6:21,360,000–21,368,000 region containing a HERV-H endogenous retrovirus. Gray triangles represent the two LTRs. Pink, violet, and blue boxes represent genomic fragments whose translations have similarities with Gag, Pol, and Env retroviral proteins. ChIP-seq tags density difference between Drosha siRNA and control conditions along the sequence. Positive values indicate an excess of mapped tags in the Drosha condition. (C) Experiment was performed as in (B) except that RNAPII, RNAPII ser5, and RNAPII ser2 antibodies were used for ChIP-seq. (D) Analysis of genes targeted by Drosha. HeLa LTR-Luc cells transfected with the indicated siRNA were analyzed by ChIP assay using antibody against Drosha (top) or by NRO (bottom). Regions amplified by q-PCR using specific oligonucleotides are indicated. ChIP results are presented as fold enrichment over that of a mock precipitation using an unrelated IgG antiserum. For NRO, values were normalized to the amount of GAPDH RNA in the same samples. The result for Scrtreated cells was attributed a value of 1. All graphs show mean ± SE from at least three independent experiments. See also Table S2. (E) TR of RNAPII is modified by Drosha. ChIP-seq data using anti-RNAPII performed on chromatin from HeLa LTR-Luc cells transfected with the indicated siRNA were analyzed, and the TR of RNAPII was determined. (F) A proposed model for premature termination and transcriptional repression at the HIV-1 promoter. See text for details.

Similar articles

Cited by

References

    1. Abruzzi KC, Lacadie S, Rosbash M. Biochemical analysis of TREX complex recruitment to intronless and intron-containing yeast genes. EMBO J. 2004;23:2620–2631. - PMC - PubMed
    1. Affymetrix ENCODE Transcriptome Project. Cold Spring Harbor Laboratory ENCODE Transcriptome Project Post-transcriptional processing generates a diversity of 5′-modified long and short RNAs. Nature. 2009;457:1028–1032. - PMC - PubMed
    1. Ballarino M, Pagano F, Girardi E, Morlando M, Cacchiarelli D, Marchioni M, Proudfoot NJ, Bozzoni I. Coupled RNA processing and transcription of intergenic primary microRNAs. Mol. Cell. Biol. 2009;29:5632–5638. - PMC - PubMed
    1. Benhamed M, Herbig U, Ye T, Dejean A, Bischof O. Senescence is an endogenous trigger for microRNA-directed transcriptional gene silencing in human cells. Nat. Cell Biol. 2012;14:266–275. - PMC - PubMed
    1. Bennasser Y, Yeung ML, Jeang KT. HIV-1 TAR RNA subverts RNA interference in transfected cells through sequestration of TAR RNA-binding protein, TRBP. J. Biol. Chem. 2006;281:27674–27678. - PubMed

Publication types

MeSH terms

LinkOut - more resources